How to use (if using the previous version, check here)
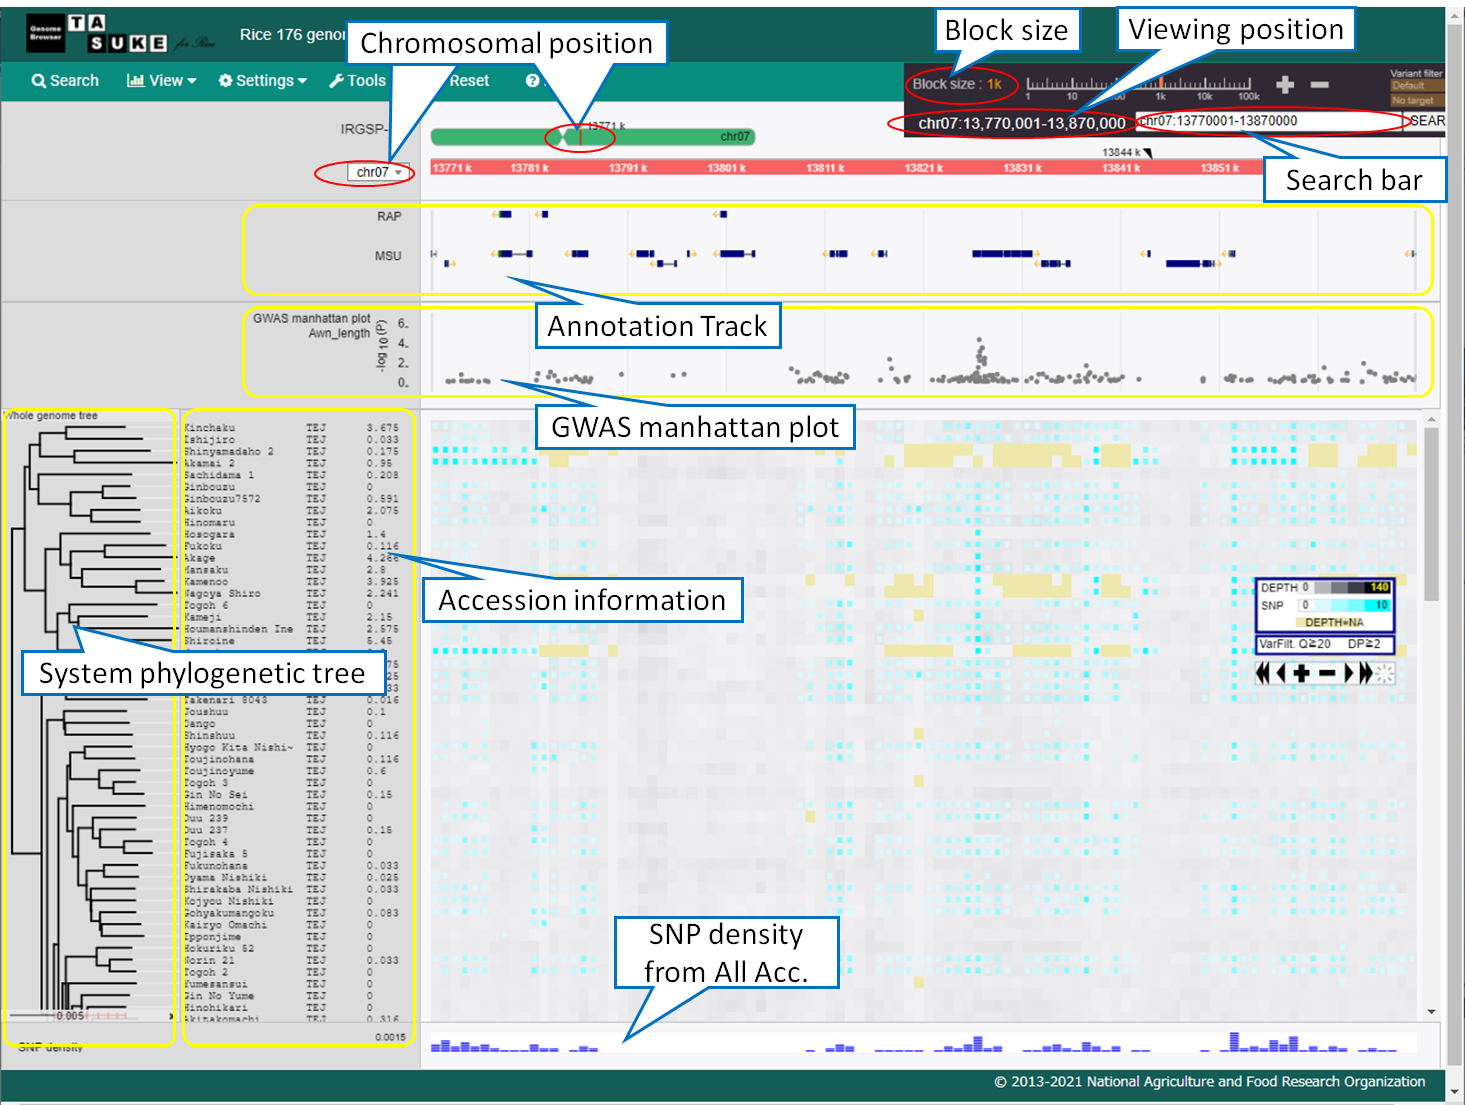
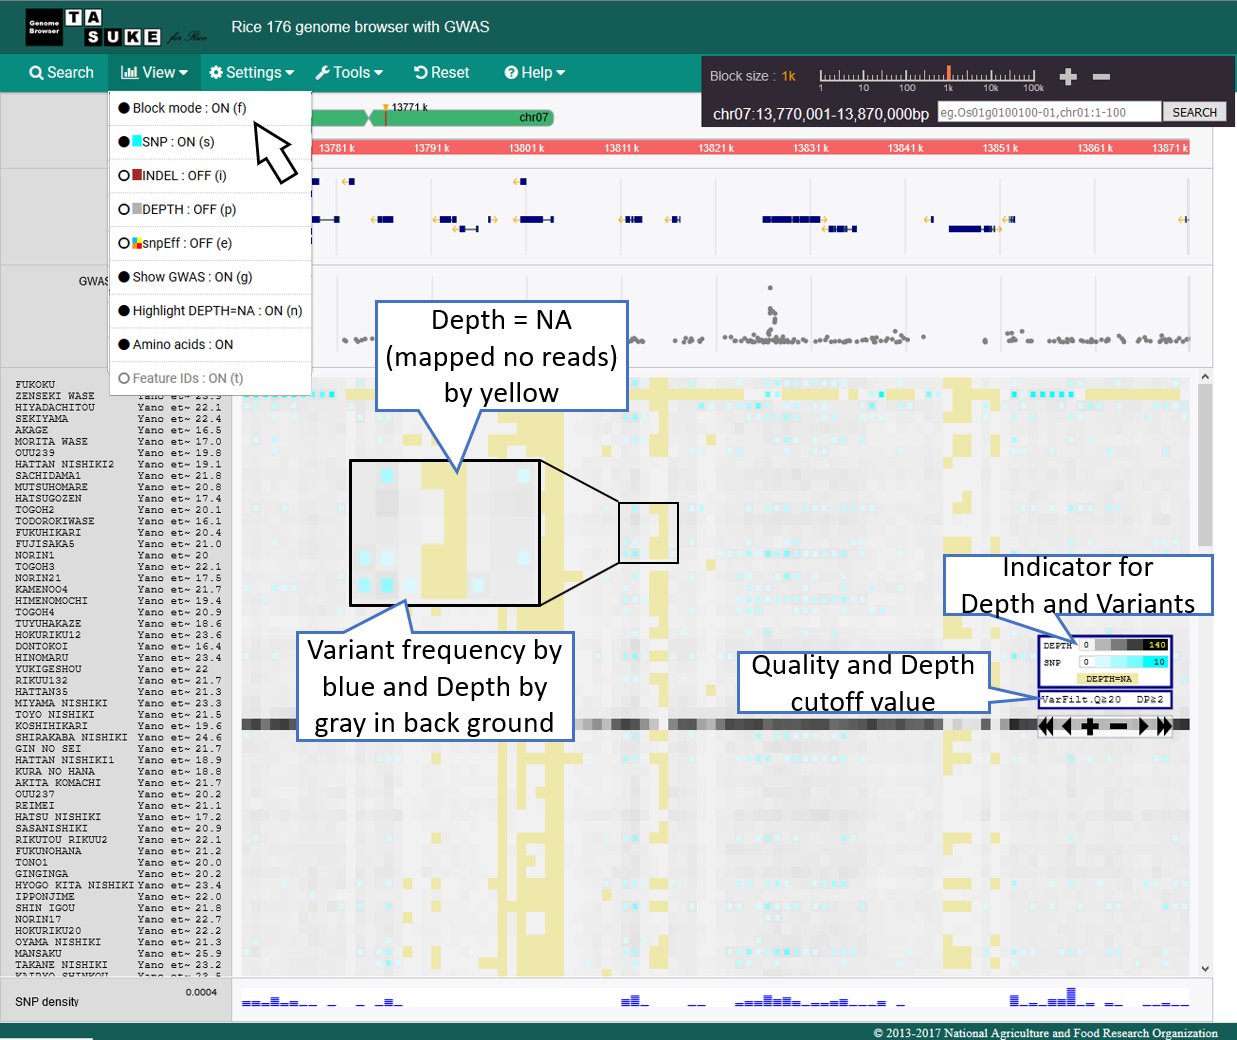
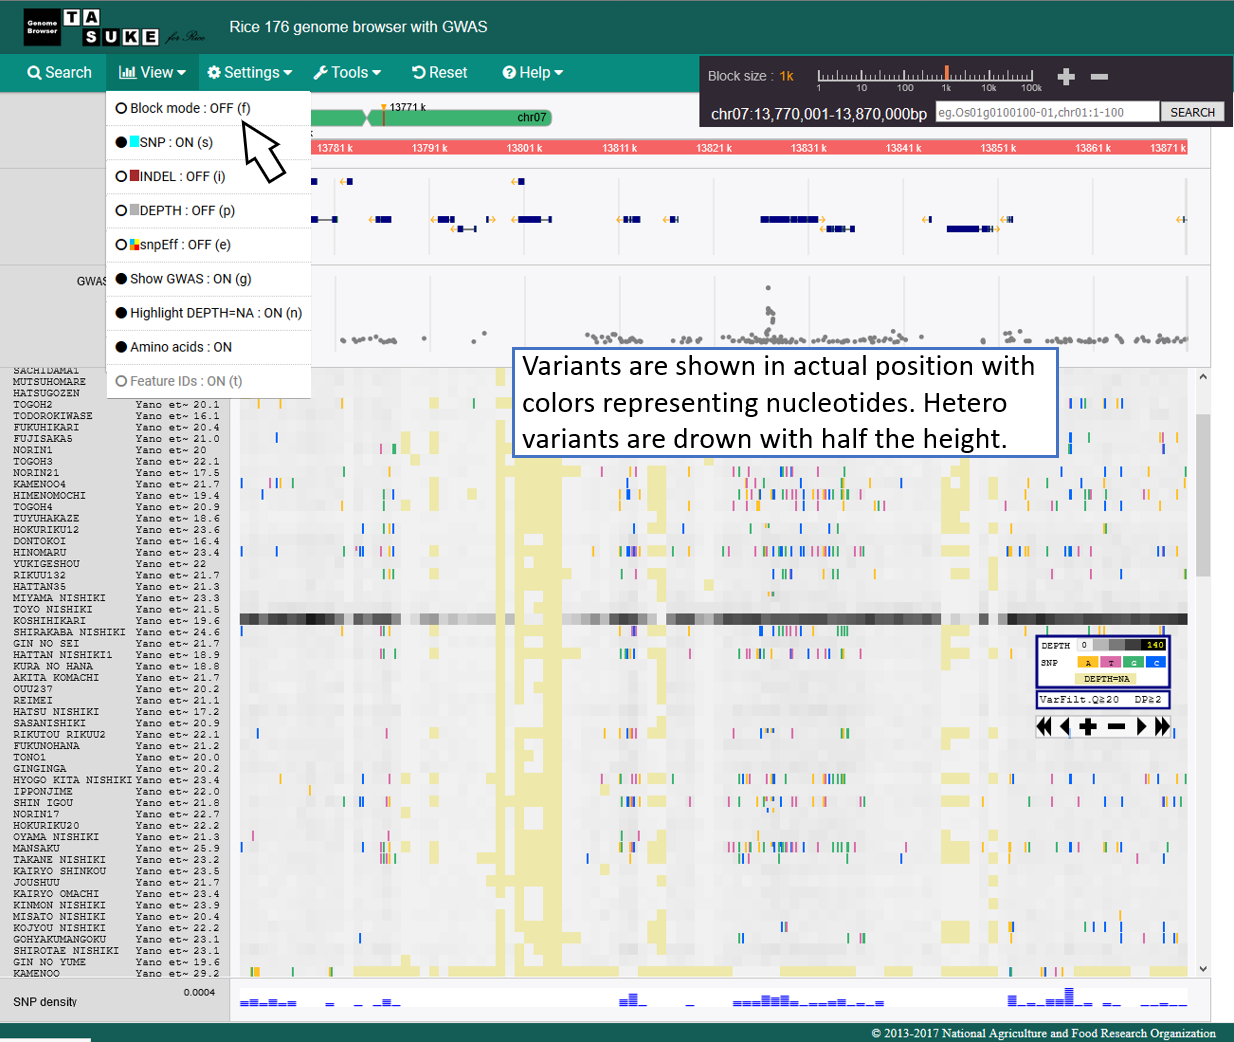
Views
Tracks
Frequency Mode
Absolute position mode
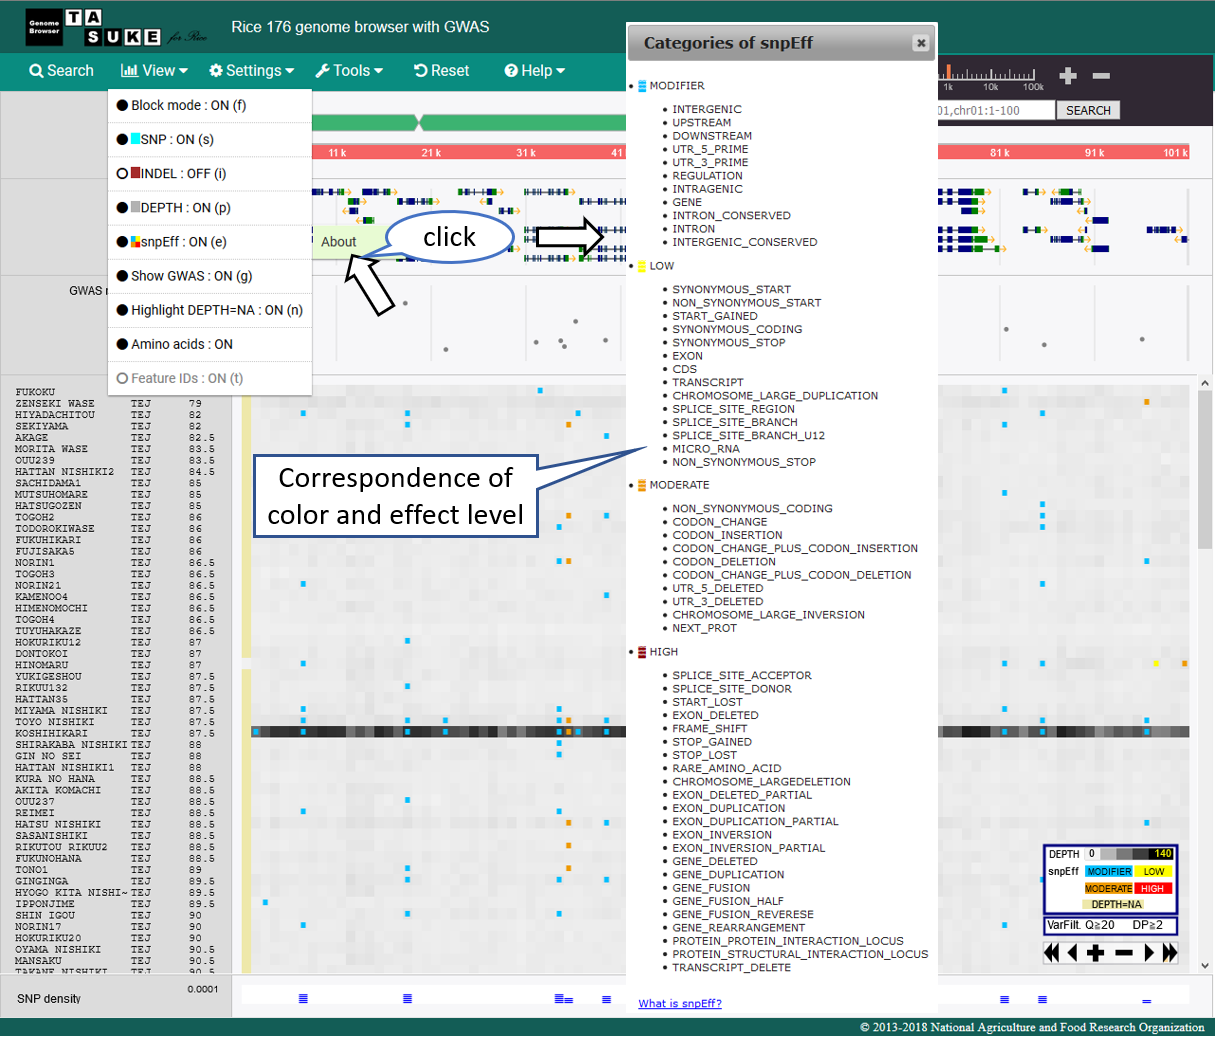
snpEff Mode
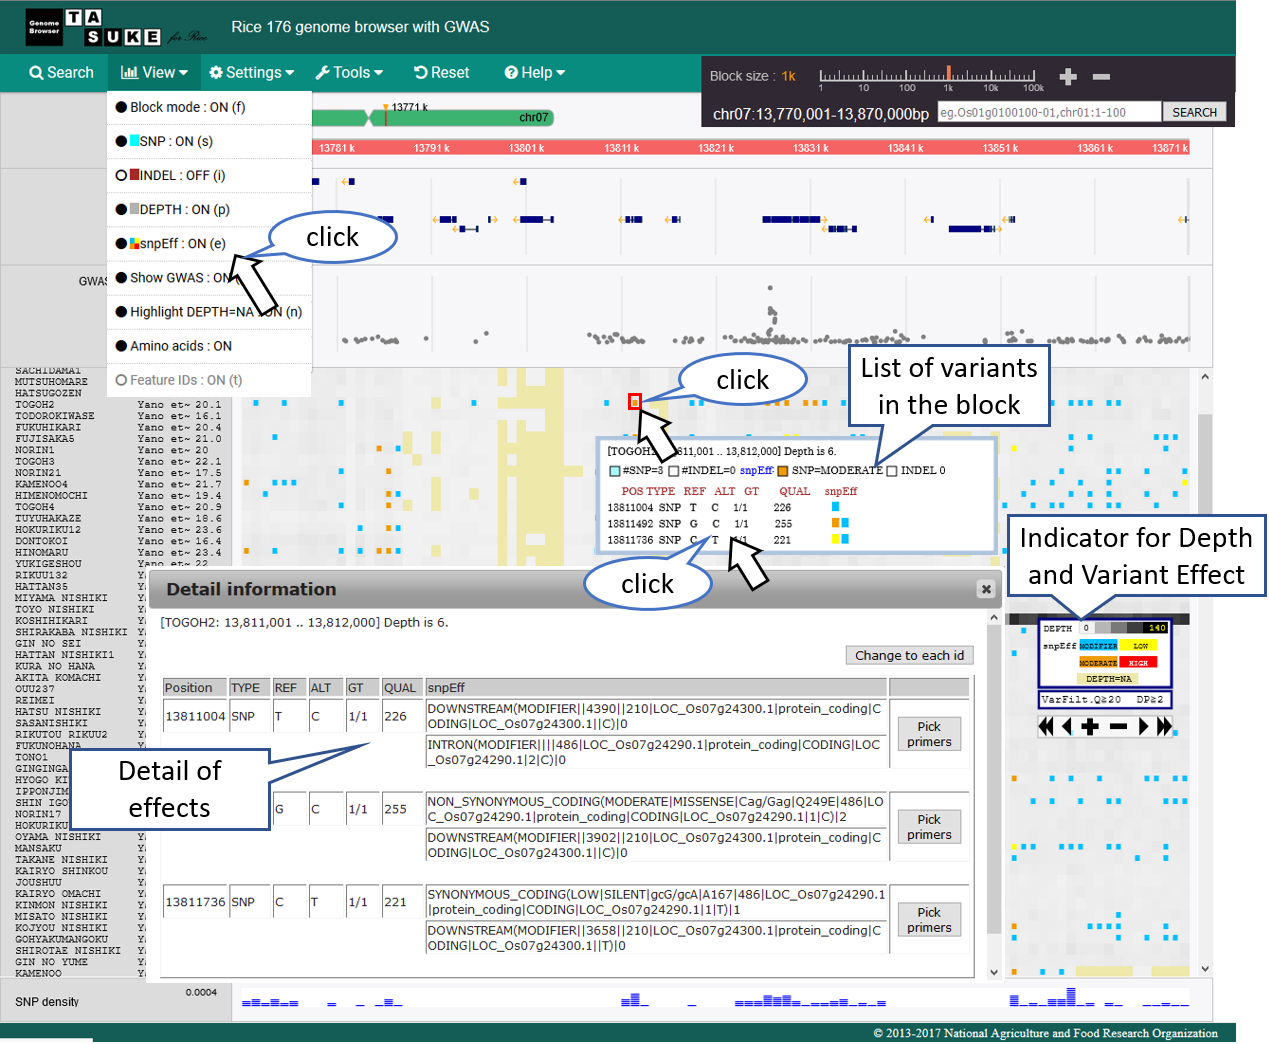
Effect category
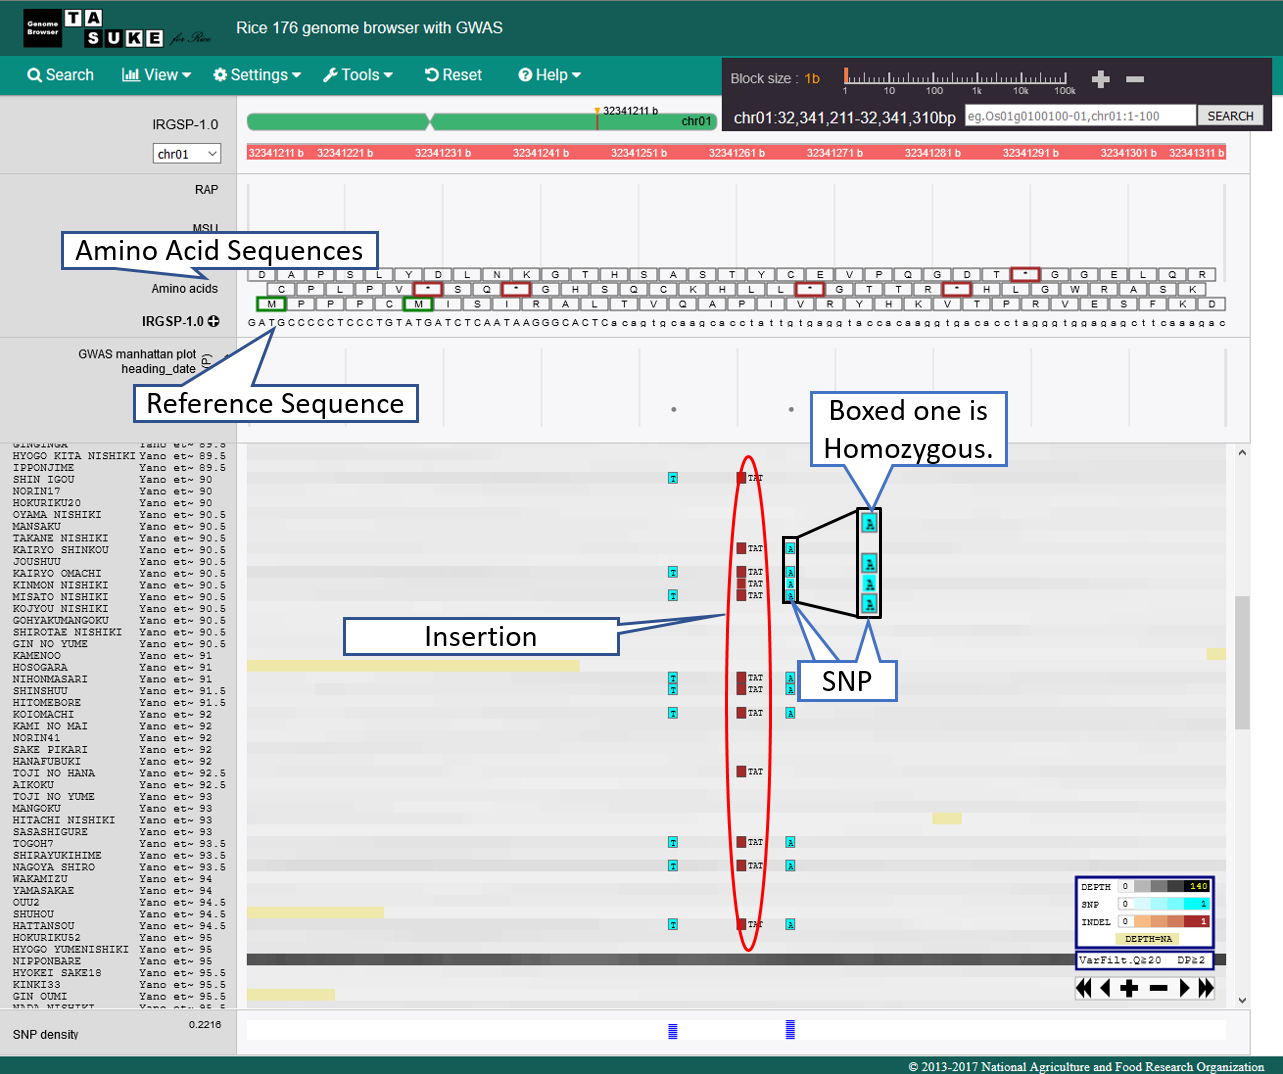
View of 1bp Scale
Annotation track
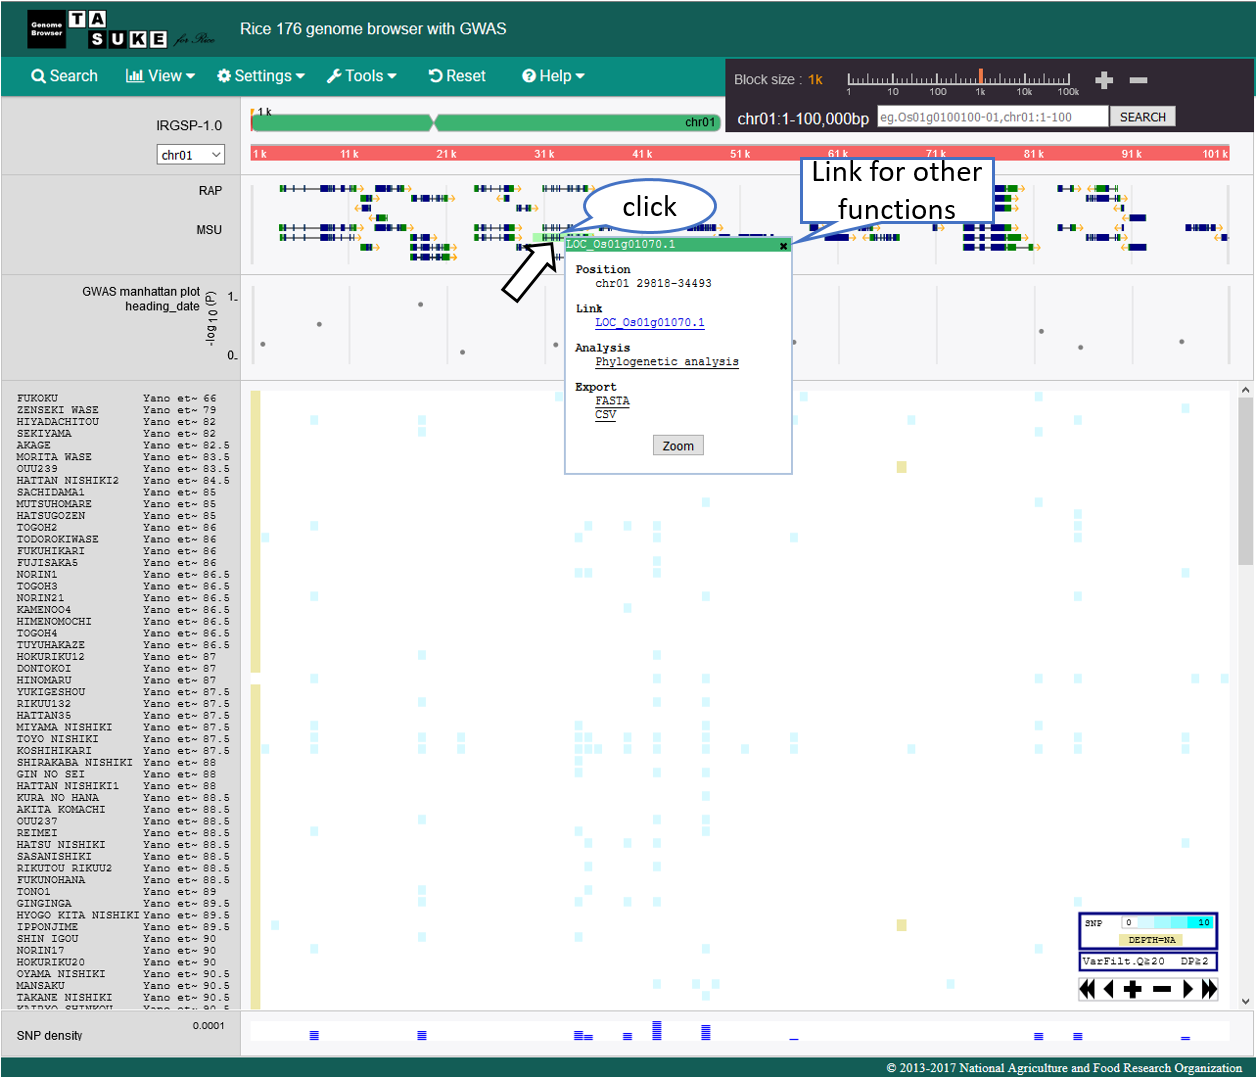
Action
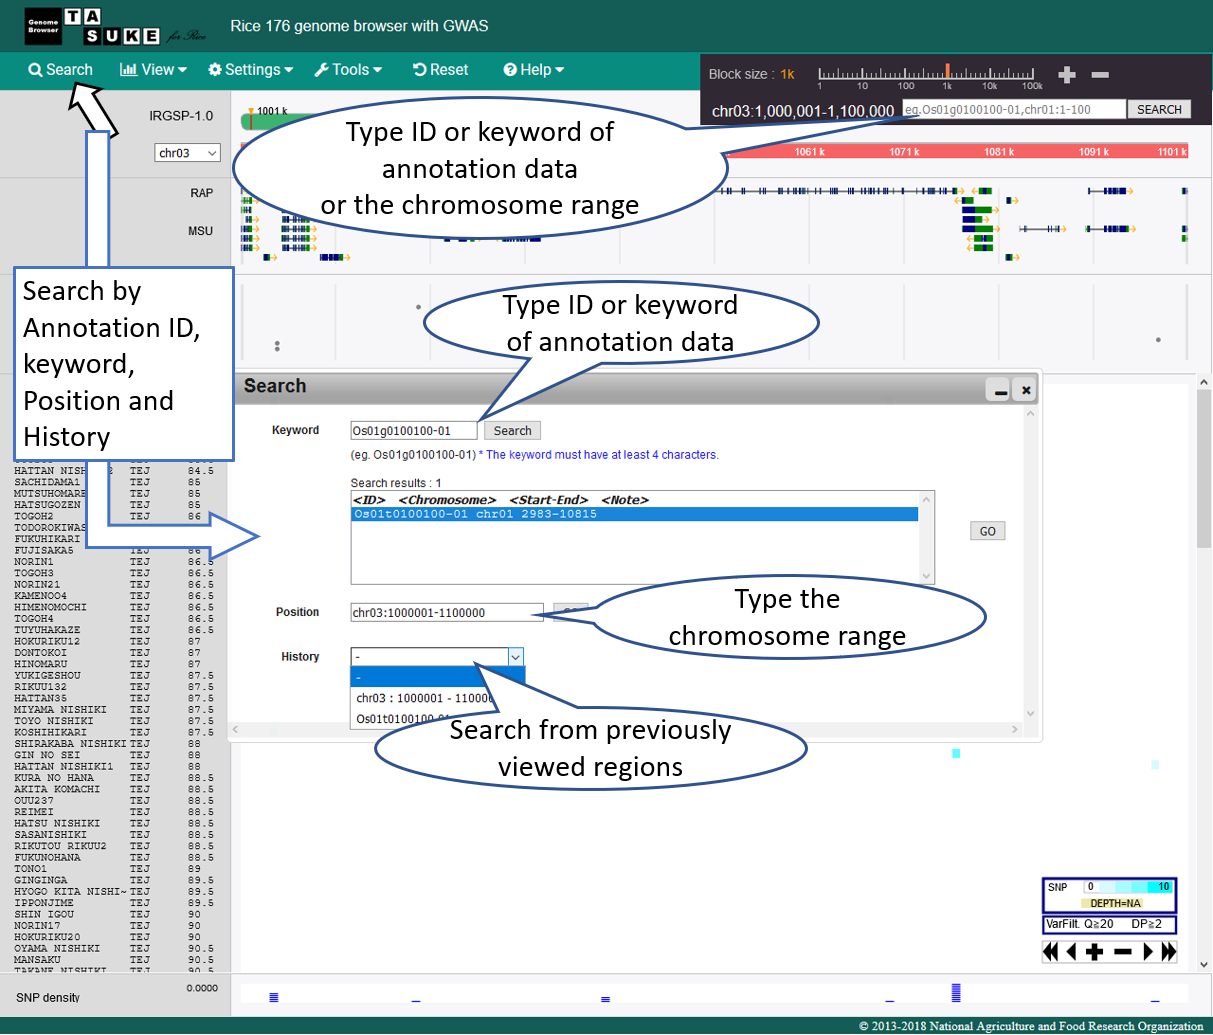
Search & Jump
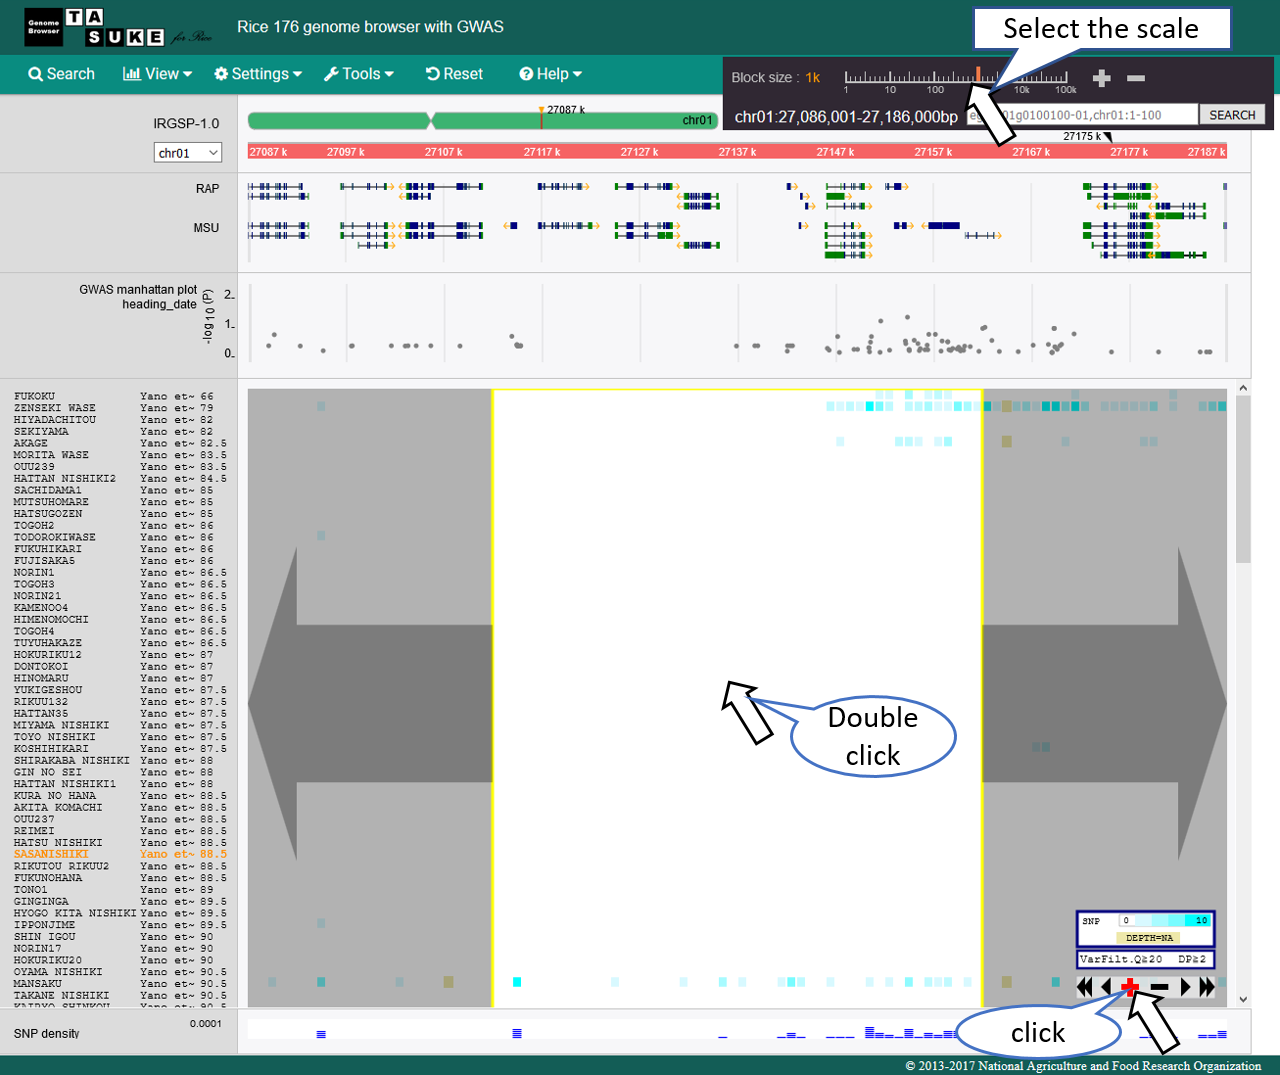
Move
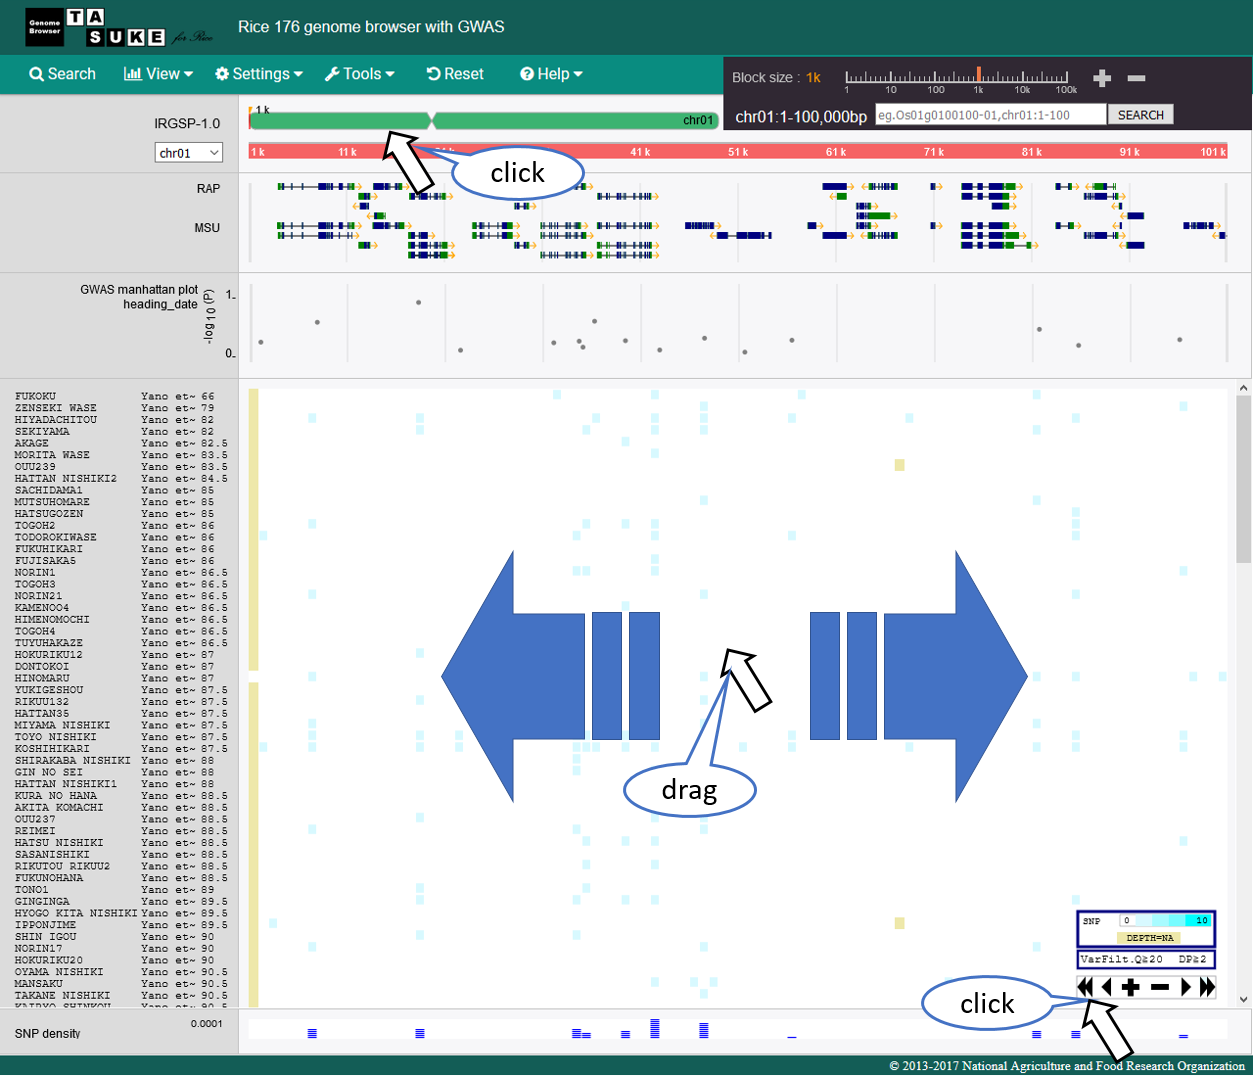
Zoom
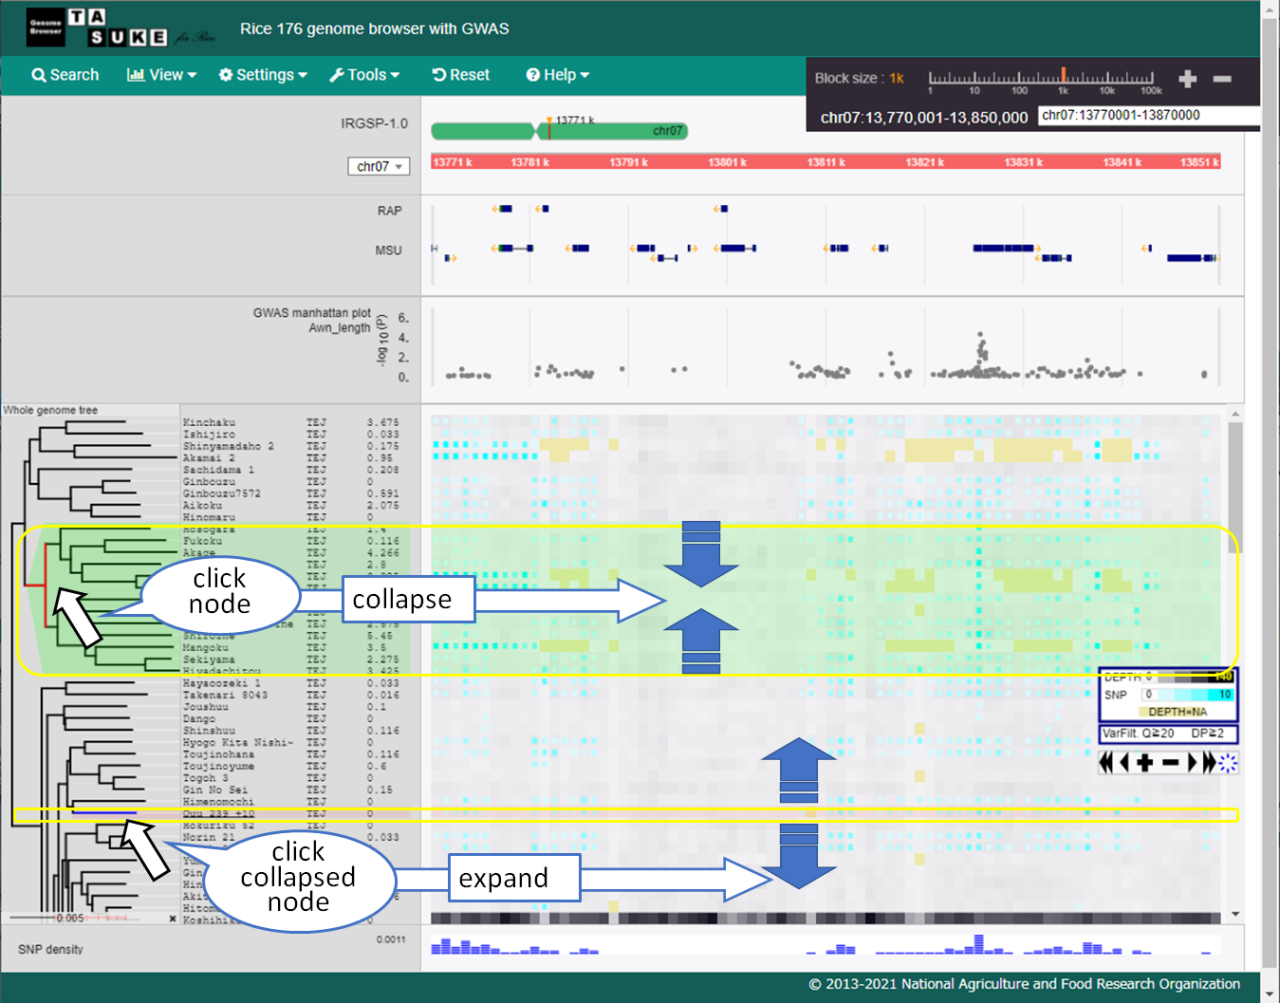
System phylogenetic tree
Settings
Accession/Tree manager
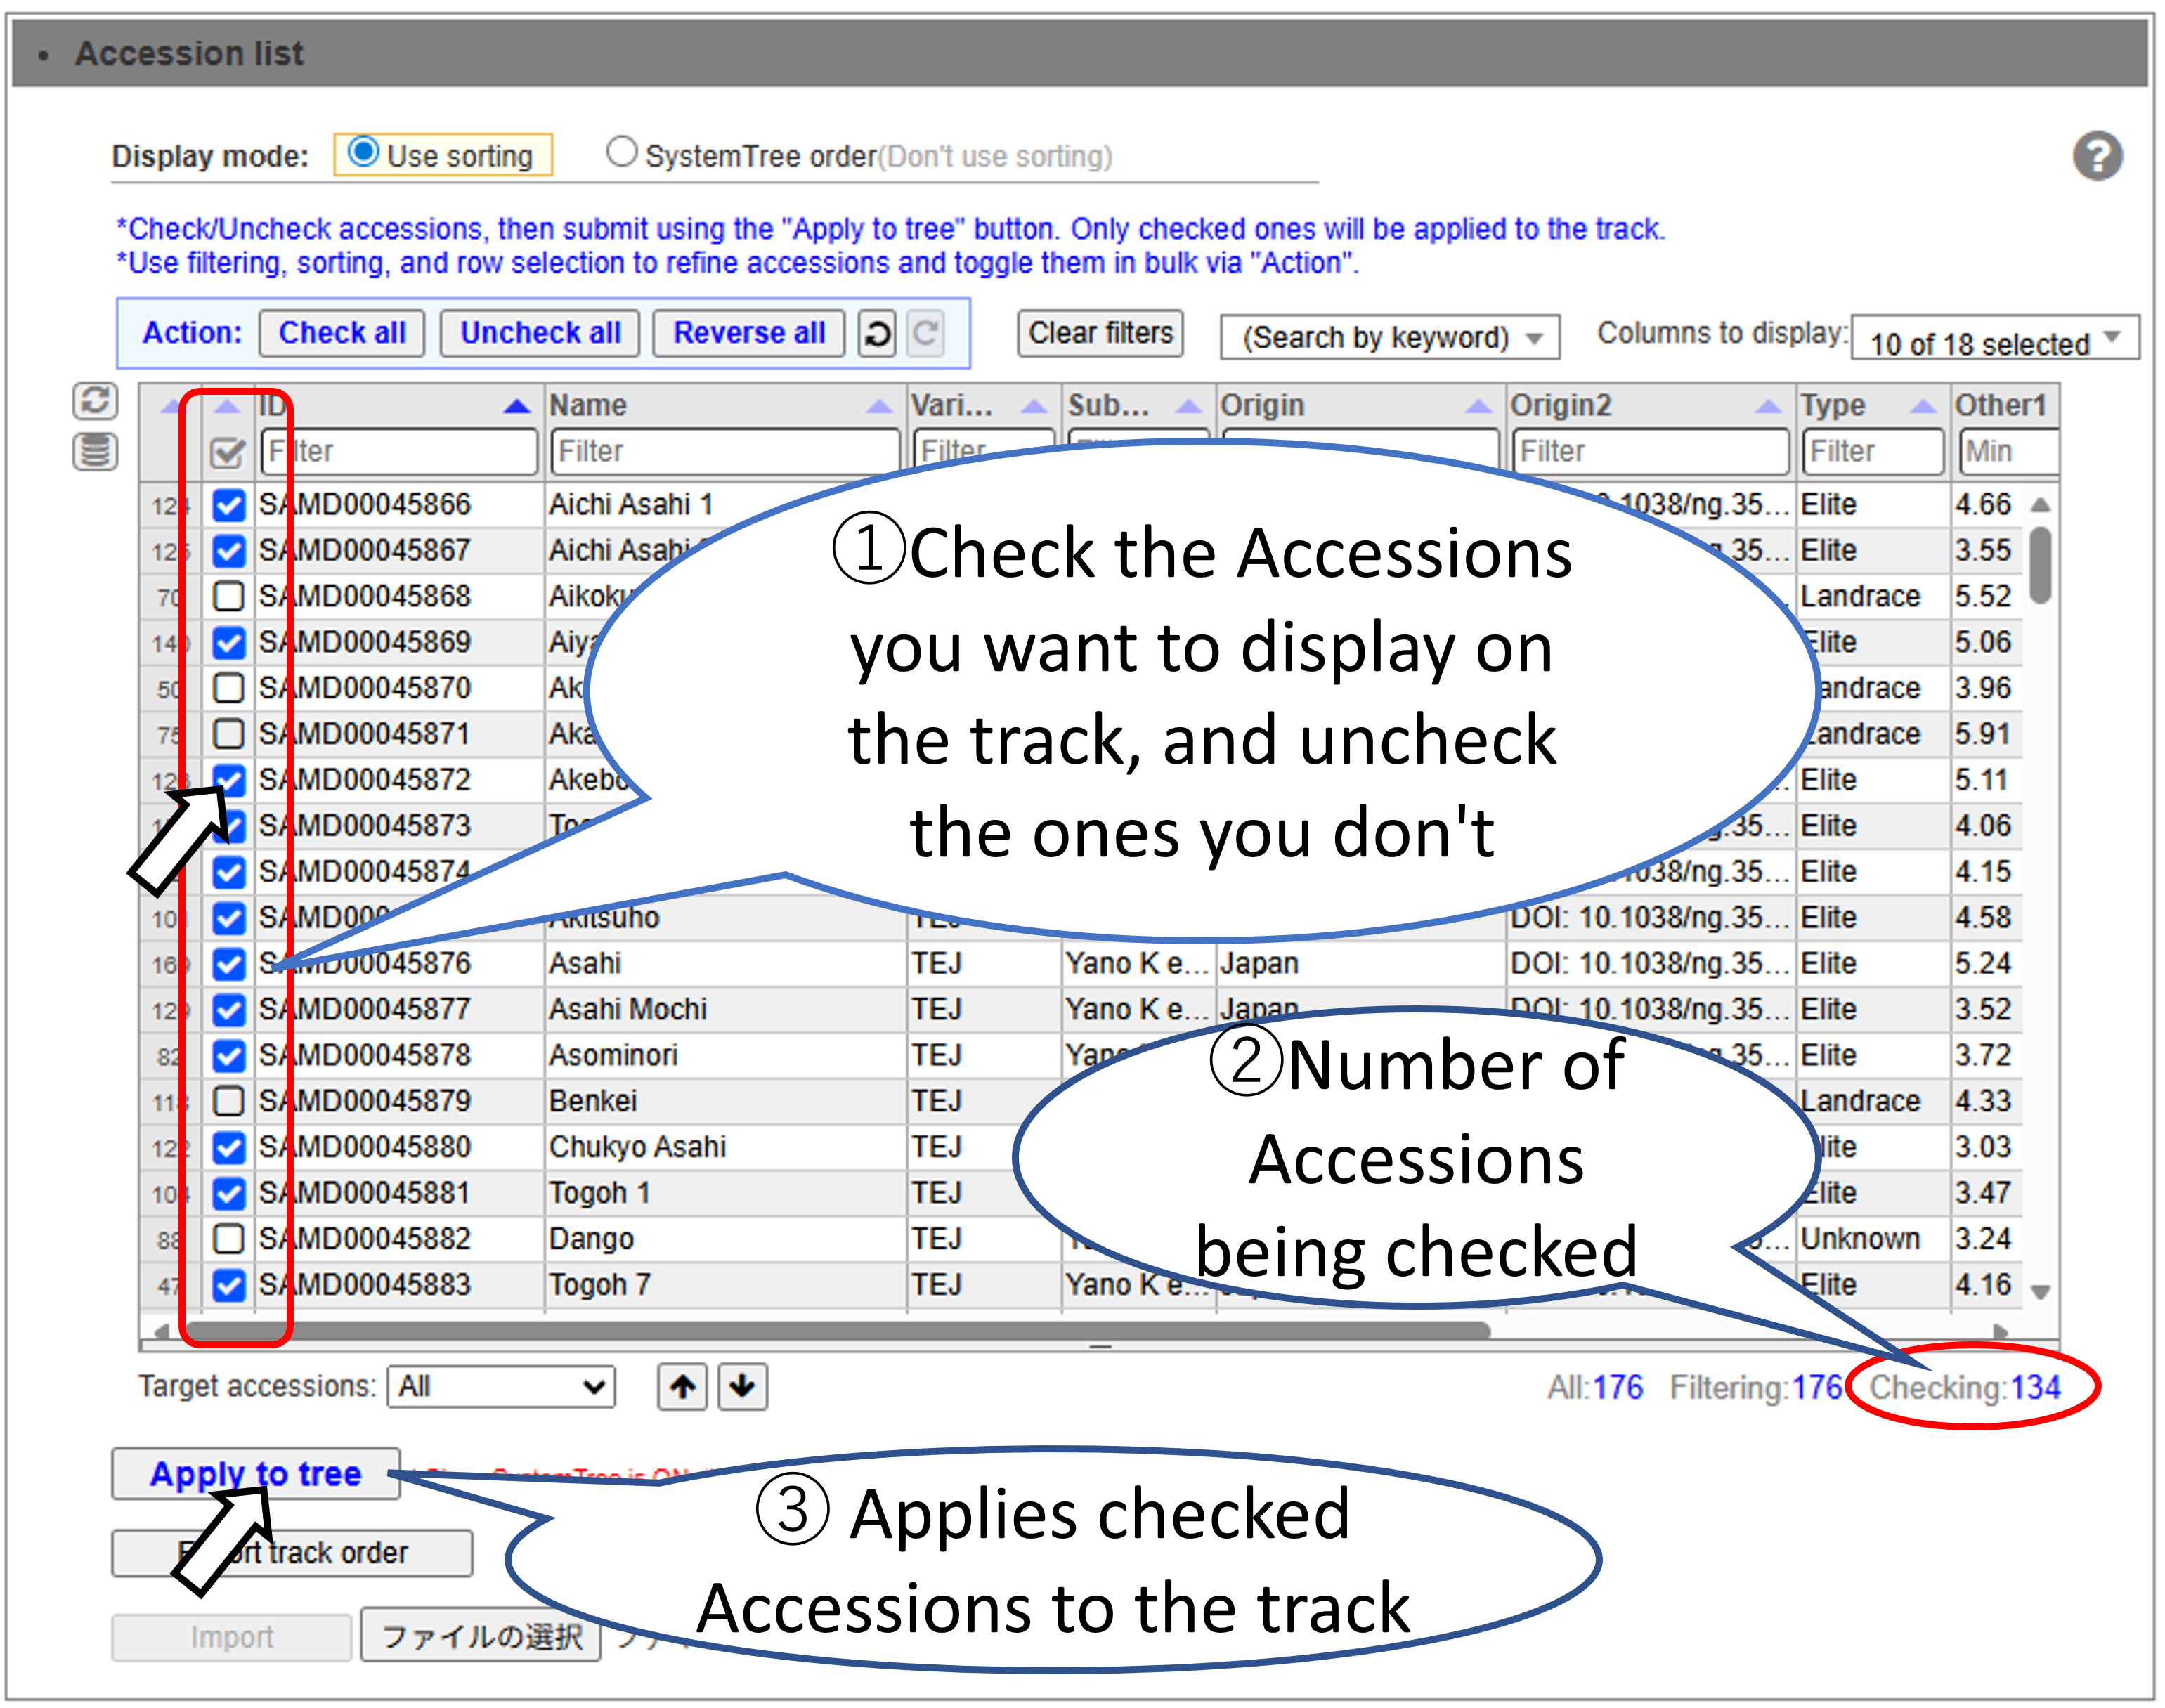
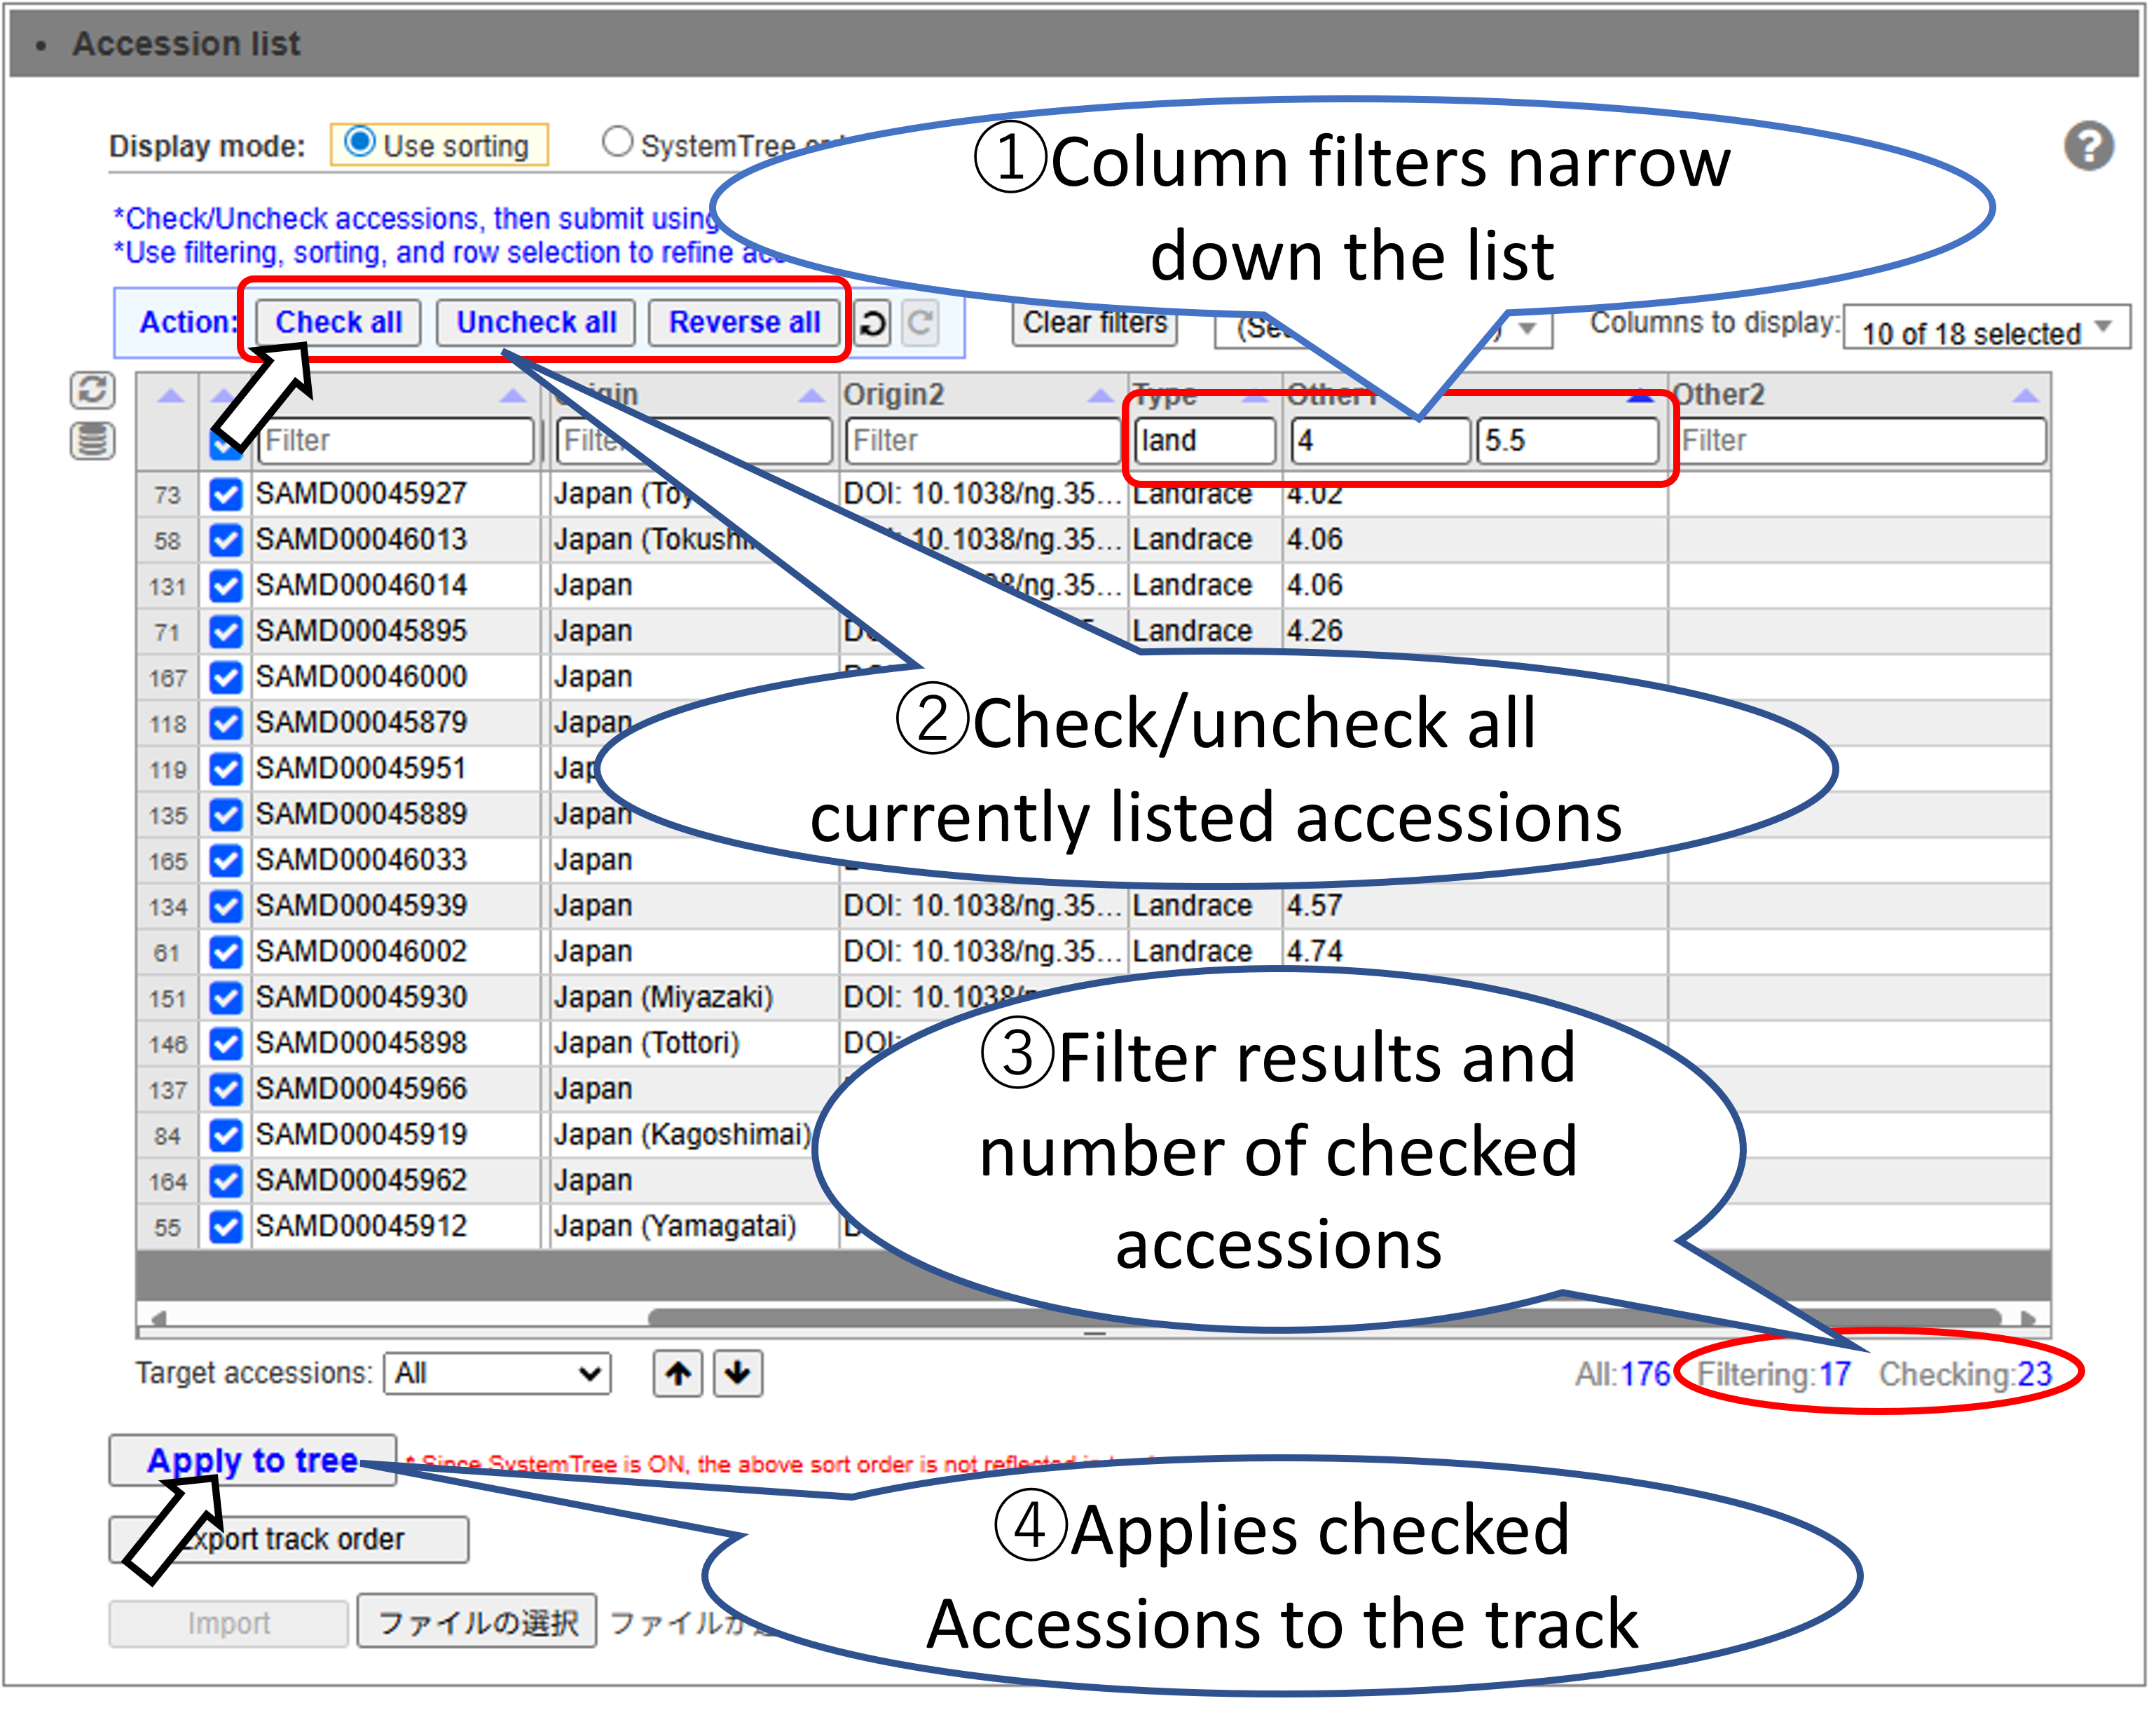
Select the Accessions to display on the track. You can efficiently select a large number of Accessions by using sorting and filtering.
Basic Accession Selection Method.
Filter and select accessions. Accessions that have been filtered out are still checked.
Sort and select the target accession range.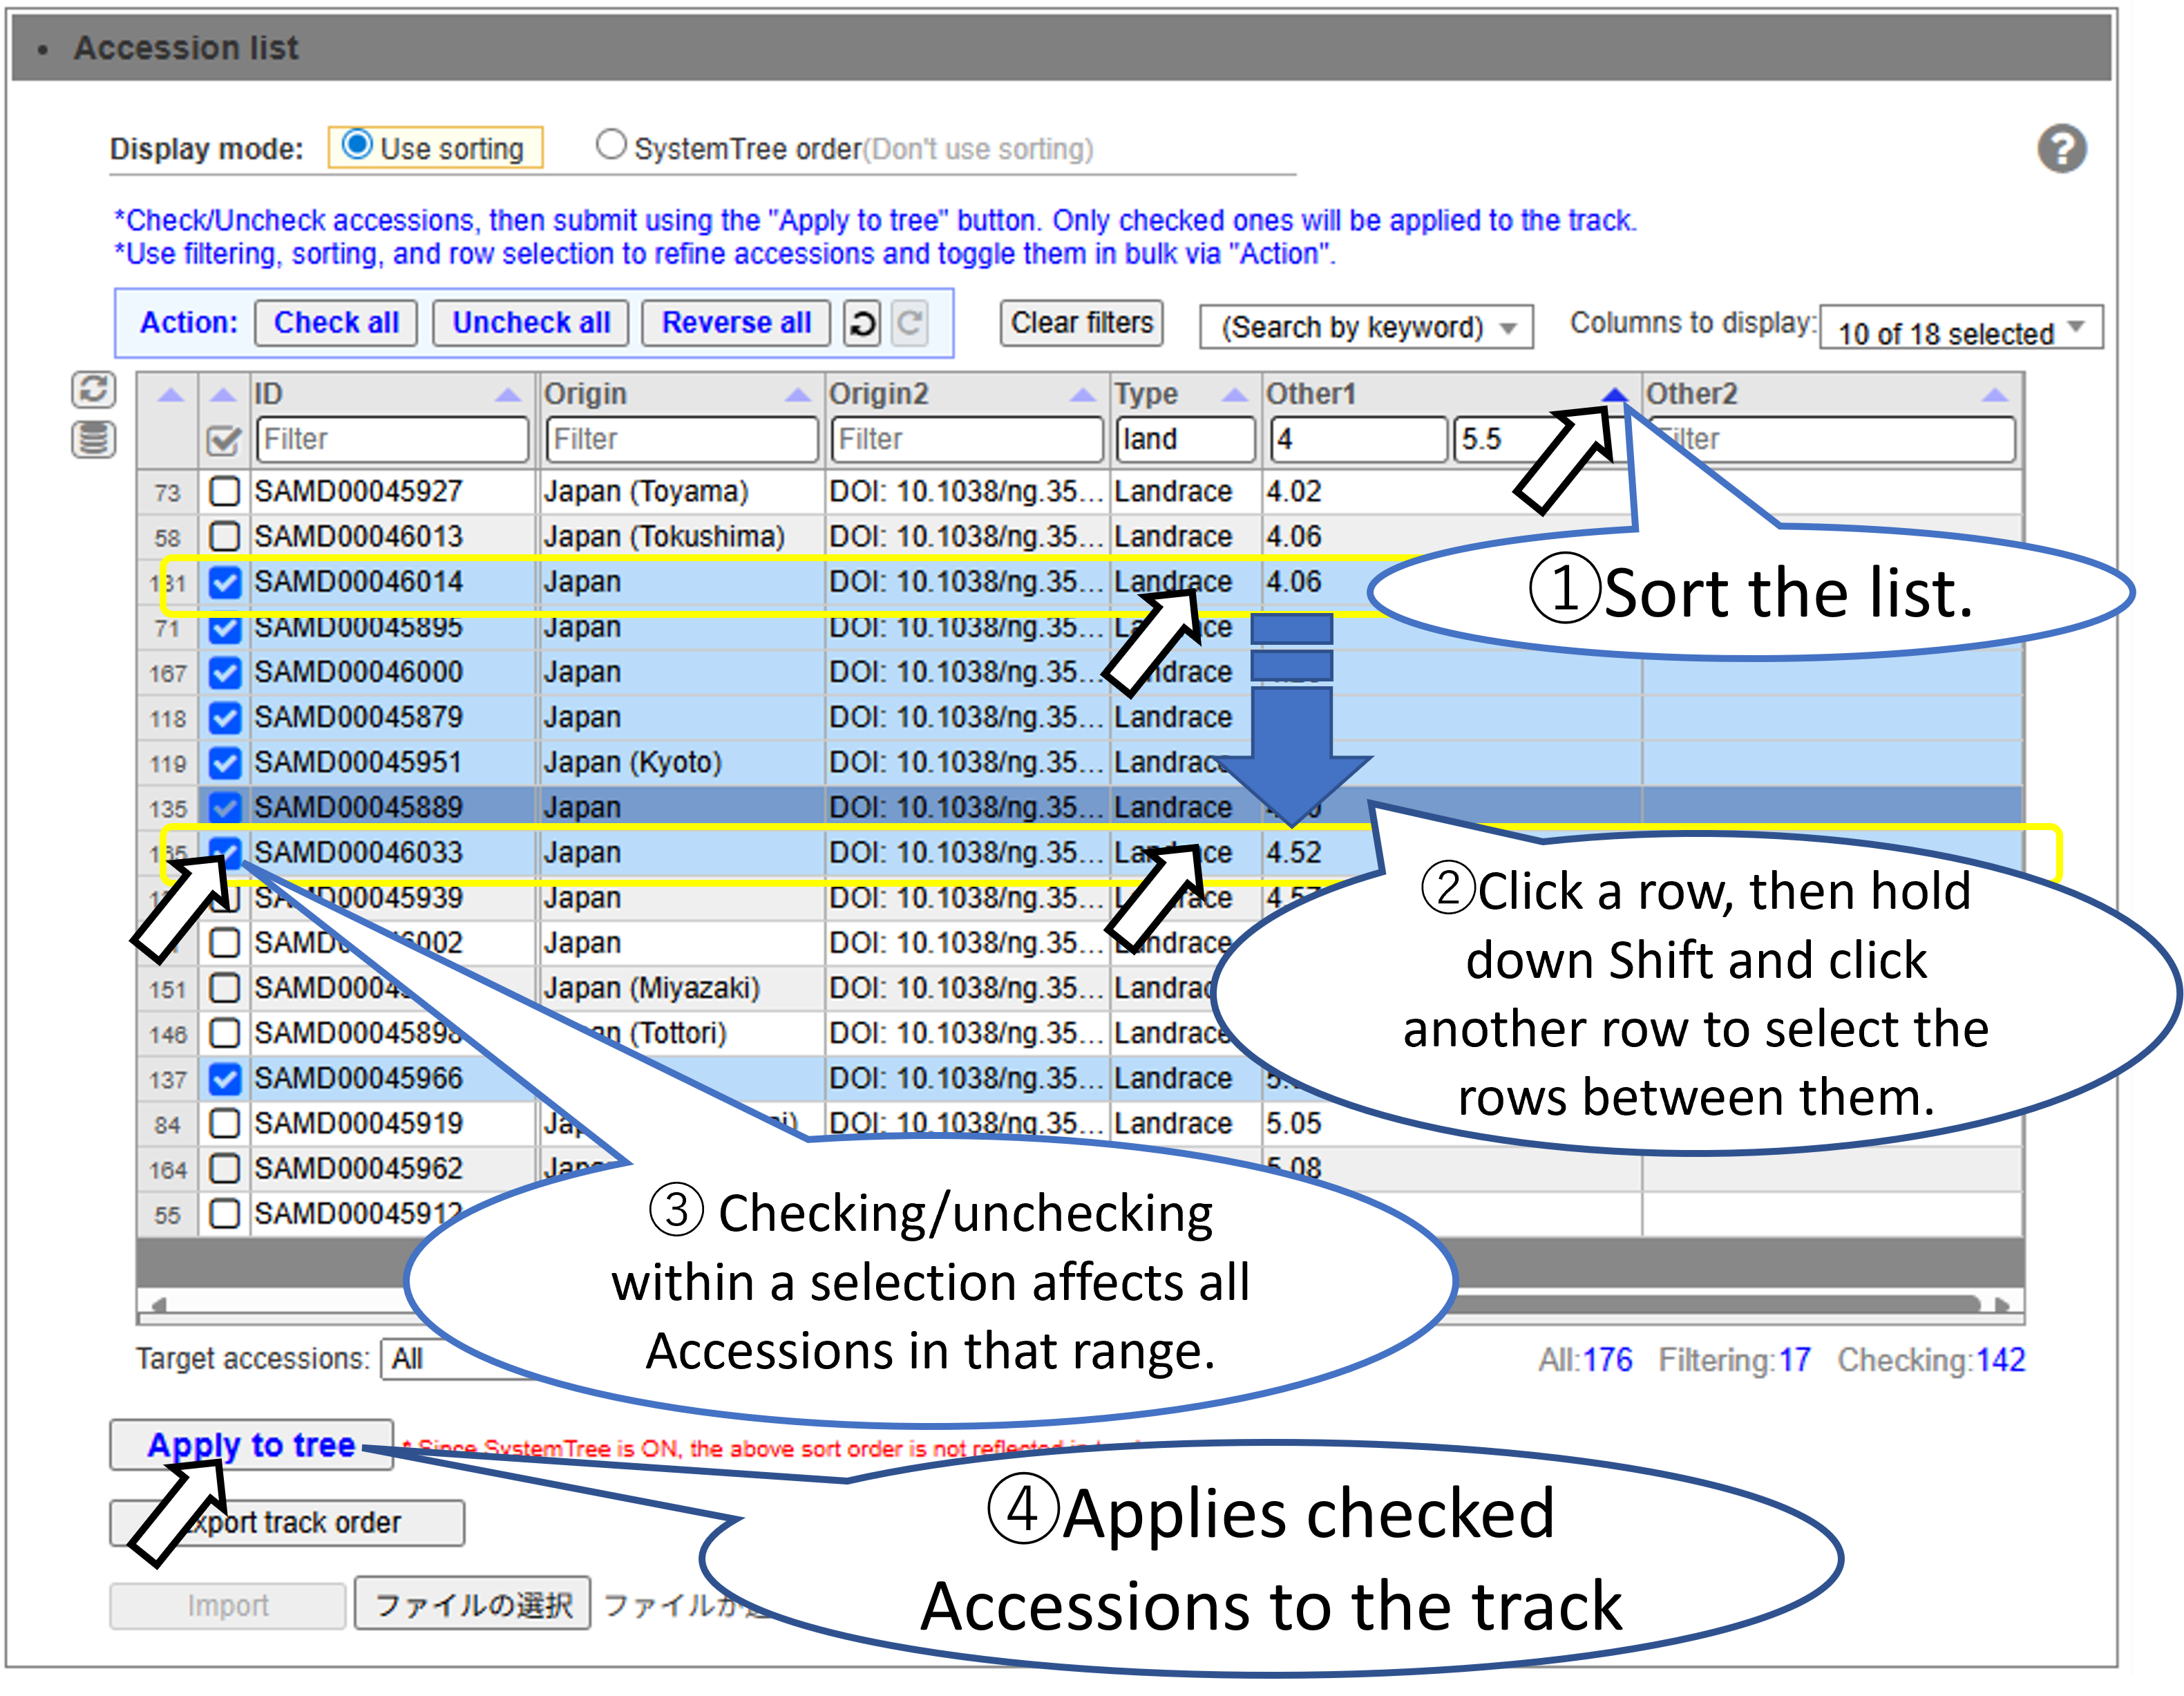
Tools
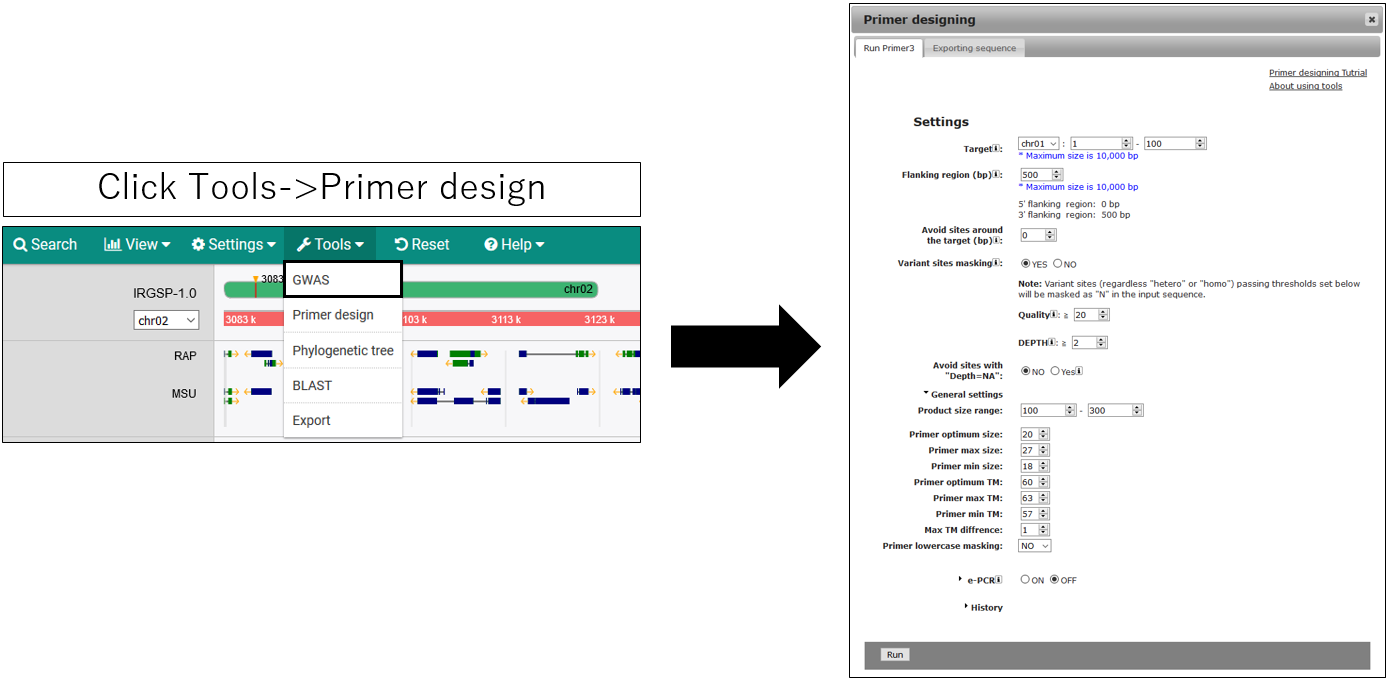
Design PRIMER
1.Open setting dialog
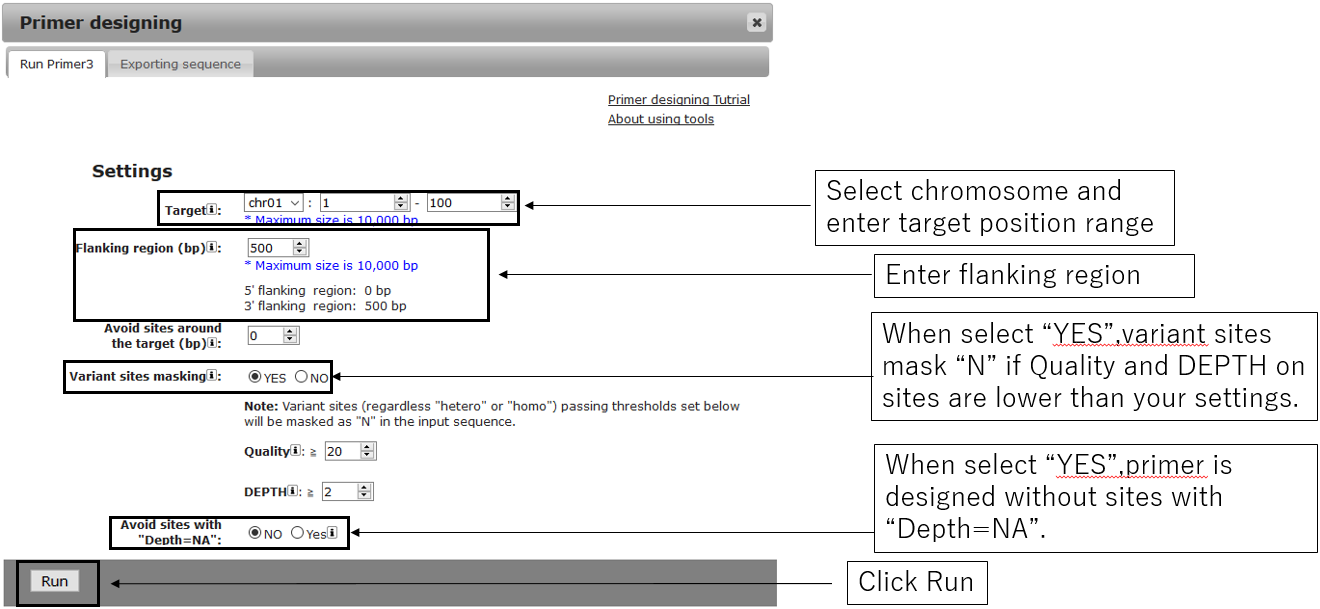
2.Parameter setting
3.Result
1.Open setting dialog
2.Parameter setting
2-1.Main settings
2-2.General settings(Optional)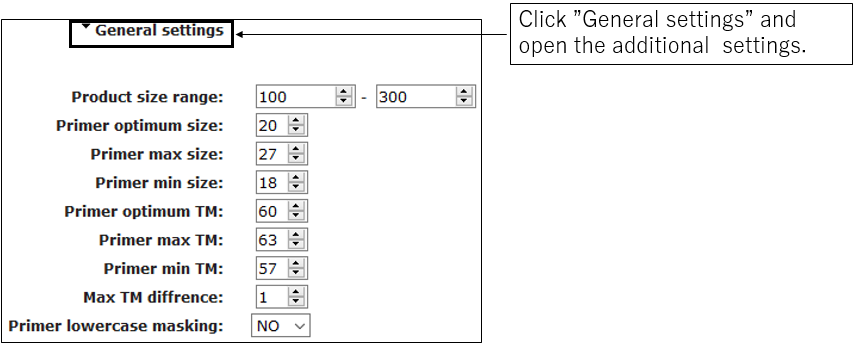
2-3.ePCR settings(Optional)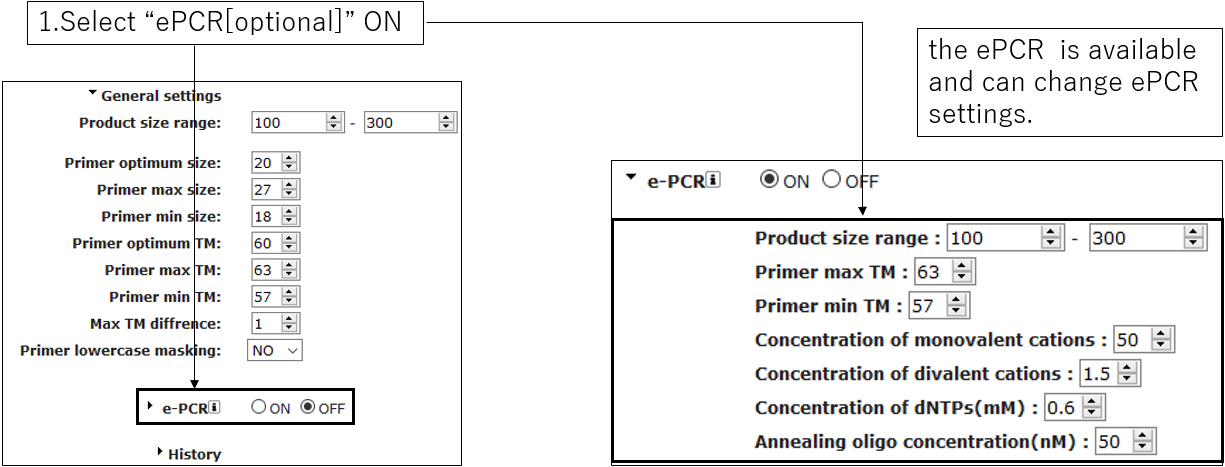
2-2.General settings(Optional)
2-3.ePCR settings(Optional)
3.Result
3-1.Result
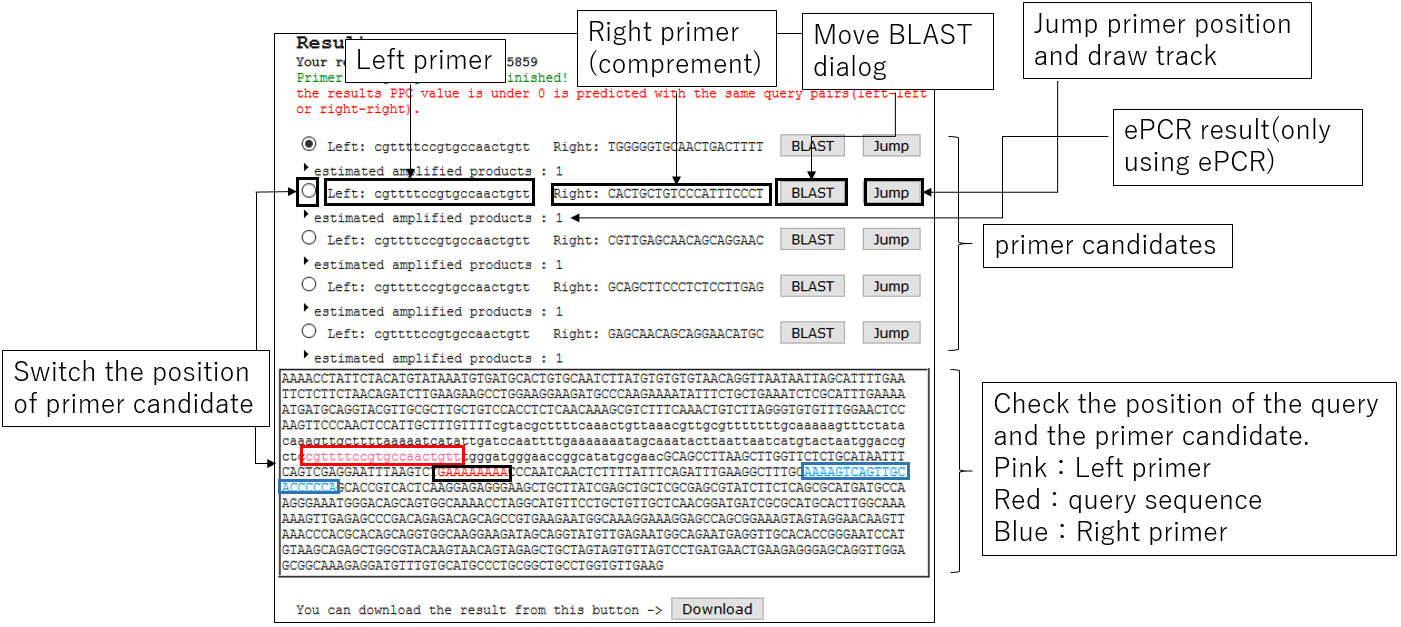
3-2.Jump BLAST with primer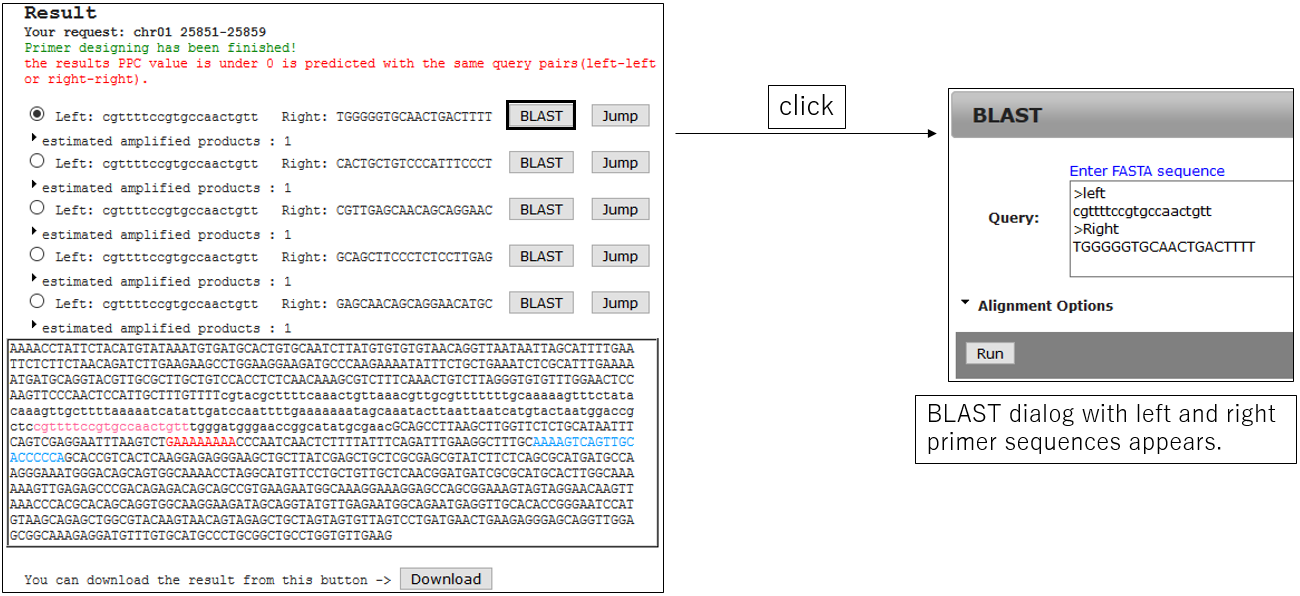
3-3.Move to the perimer designing position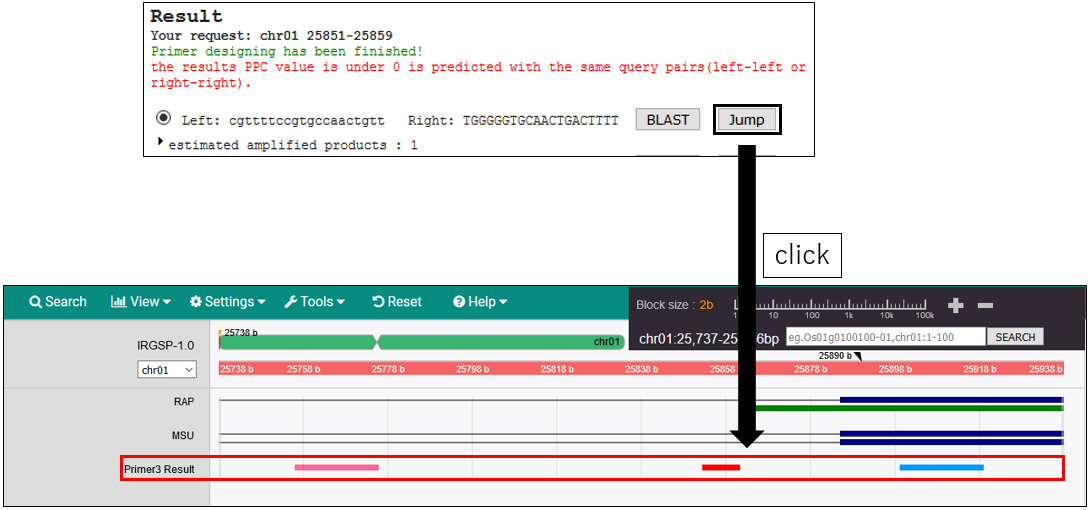
3-4.ePCR Result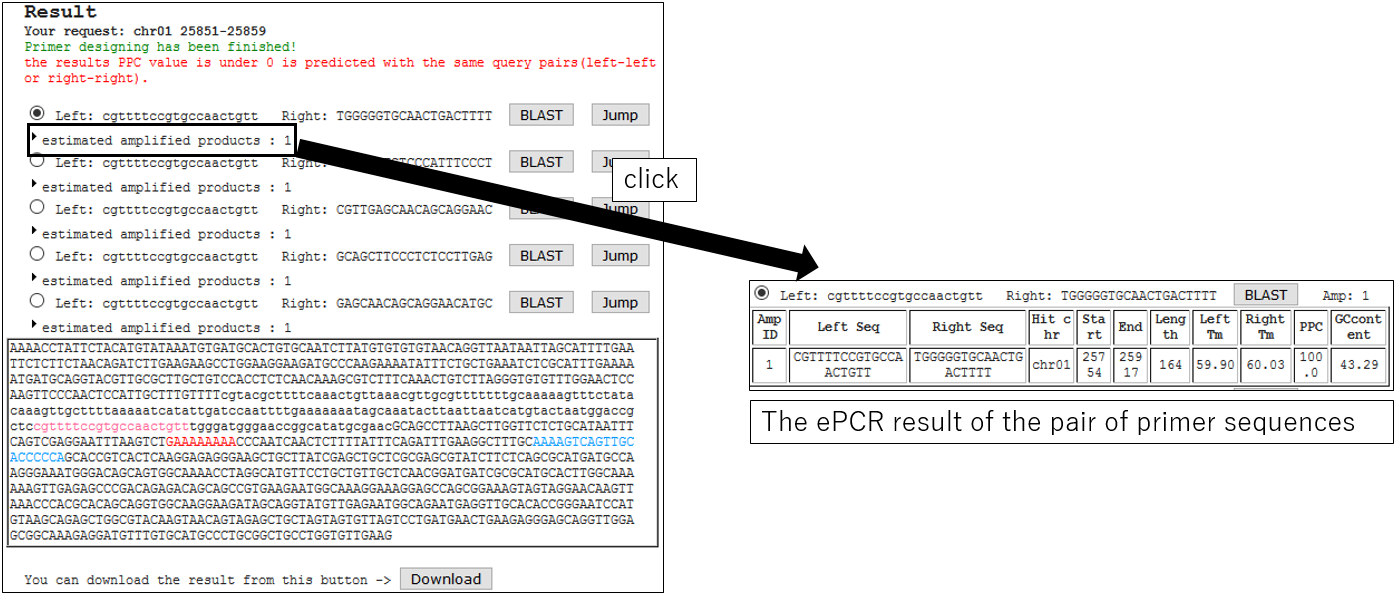
3-5.Download Result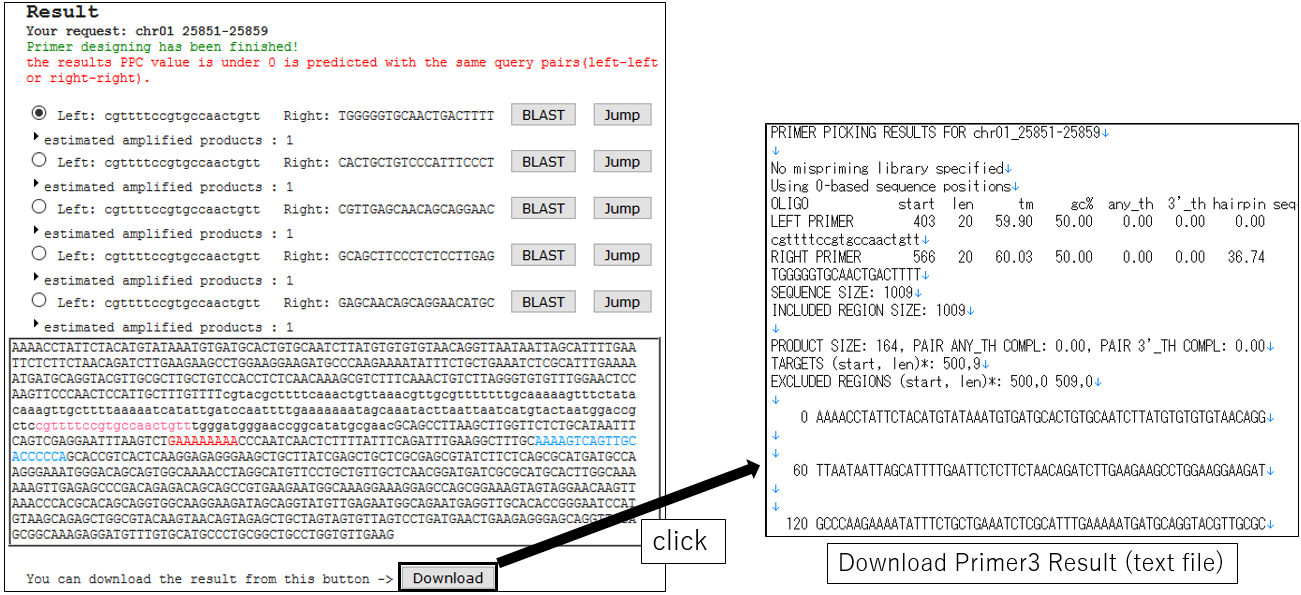
3-6.Download Result(using ePCR)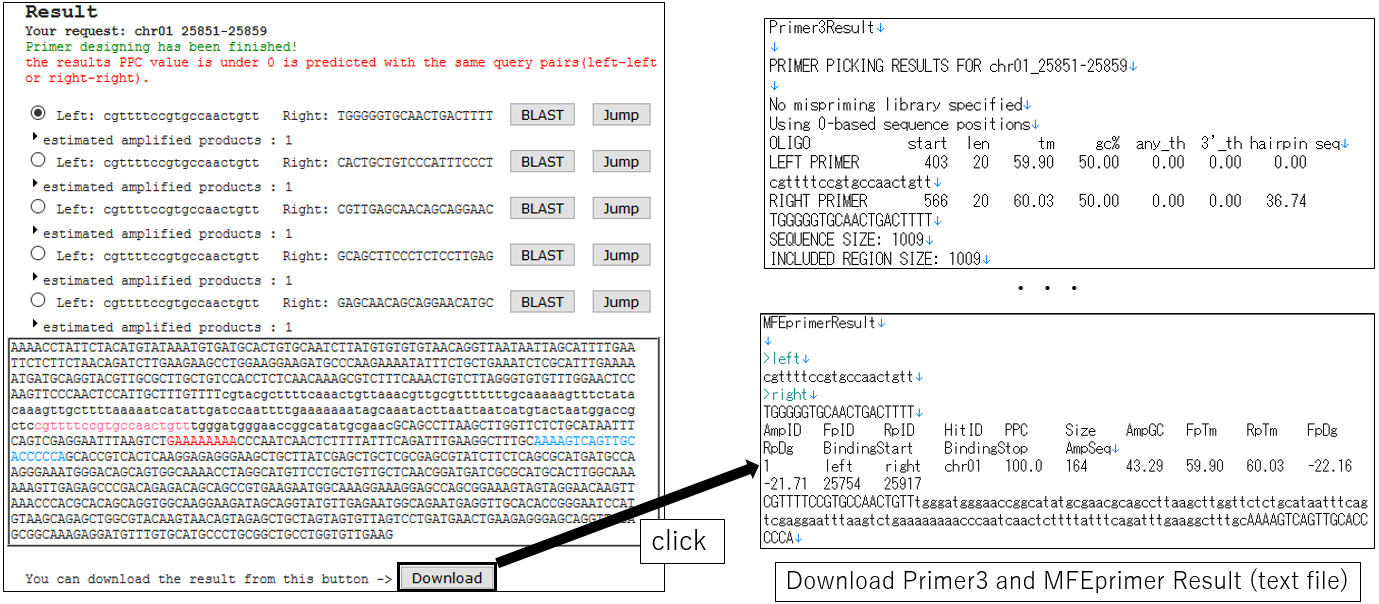
3-2.Jump BLAST with primer
3-3.Move to the perimer designing position
3-4.ePCR Result
3-5.Download Result
3-6.Download Result(using ePCR)
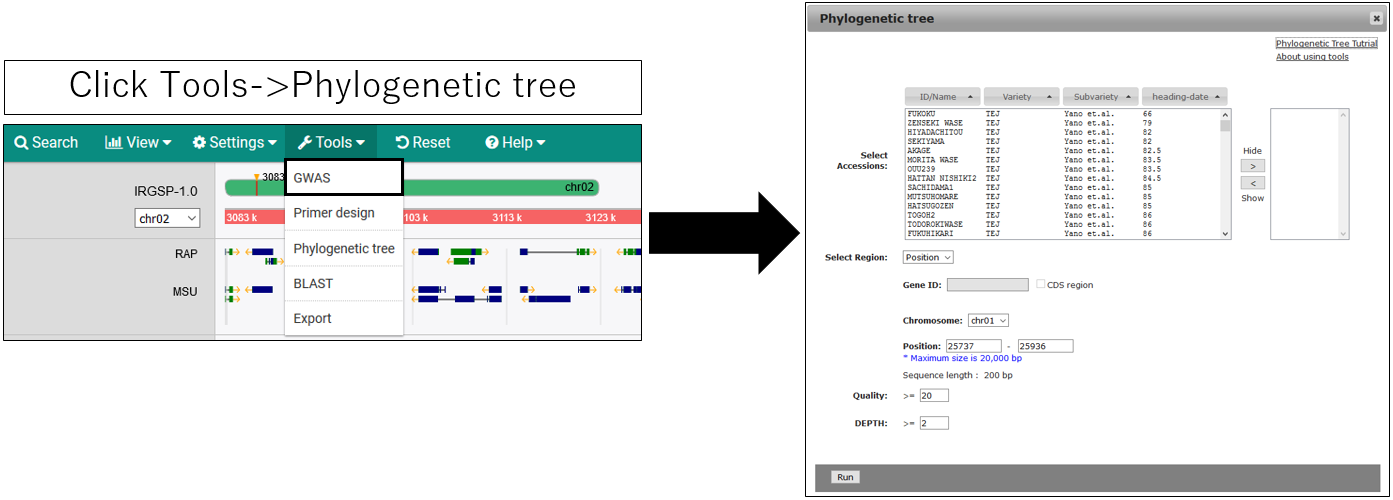
Create Phylogenetic Tree
If the accession name is set to "Name" display, the phylogenetic tree may not be displayed correctly. If so, change it to "ID" in the AccessionManager.
1.Open setting dialog
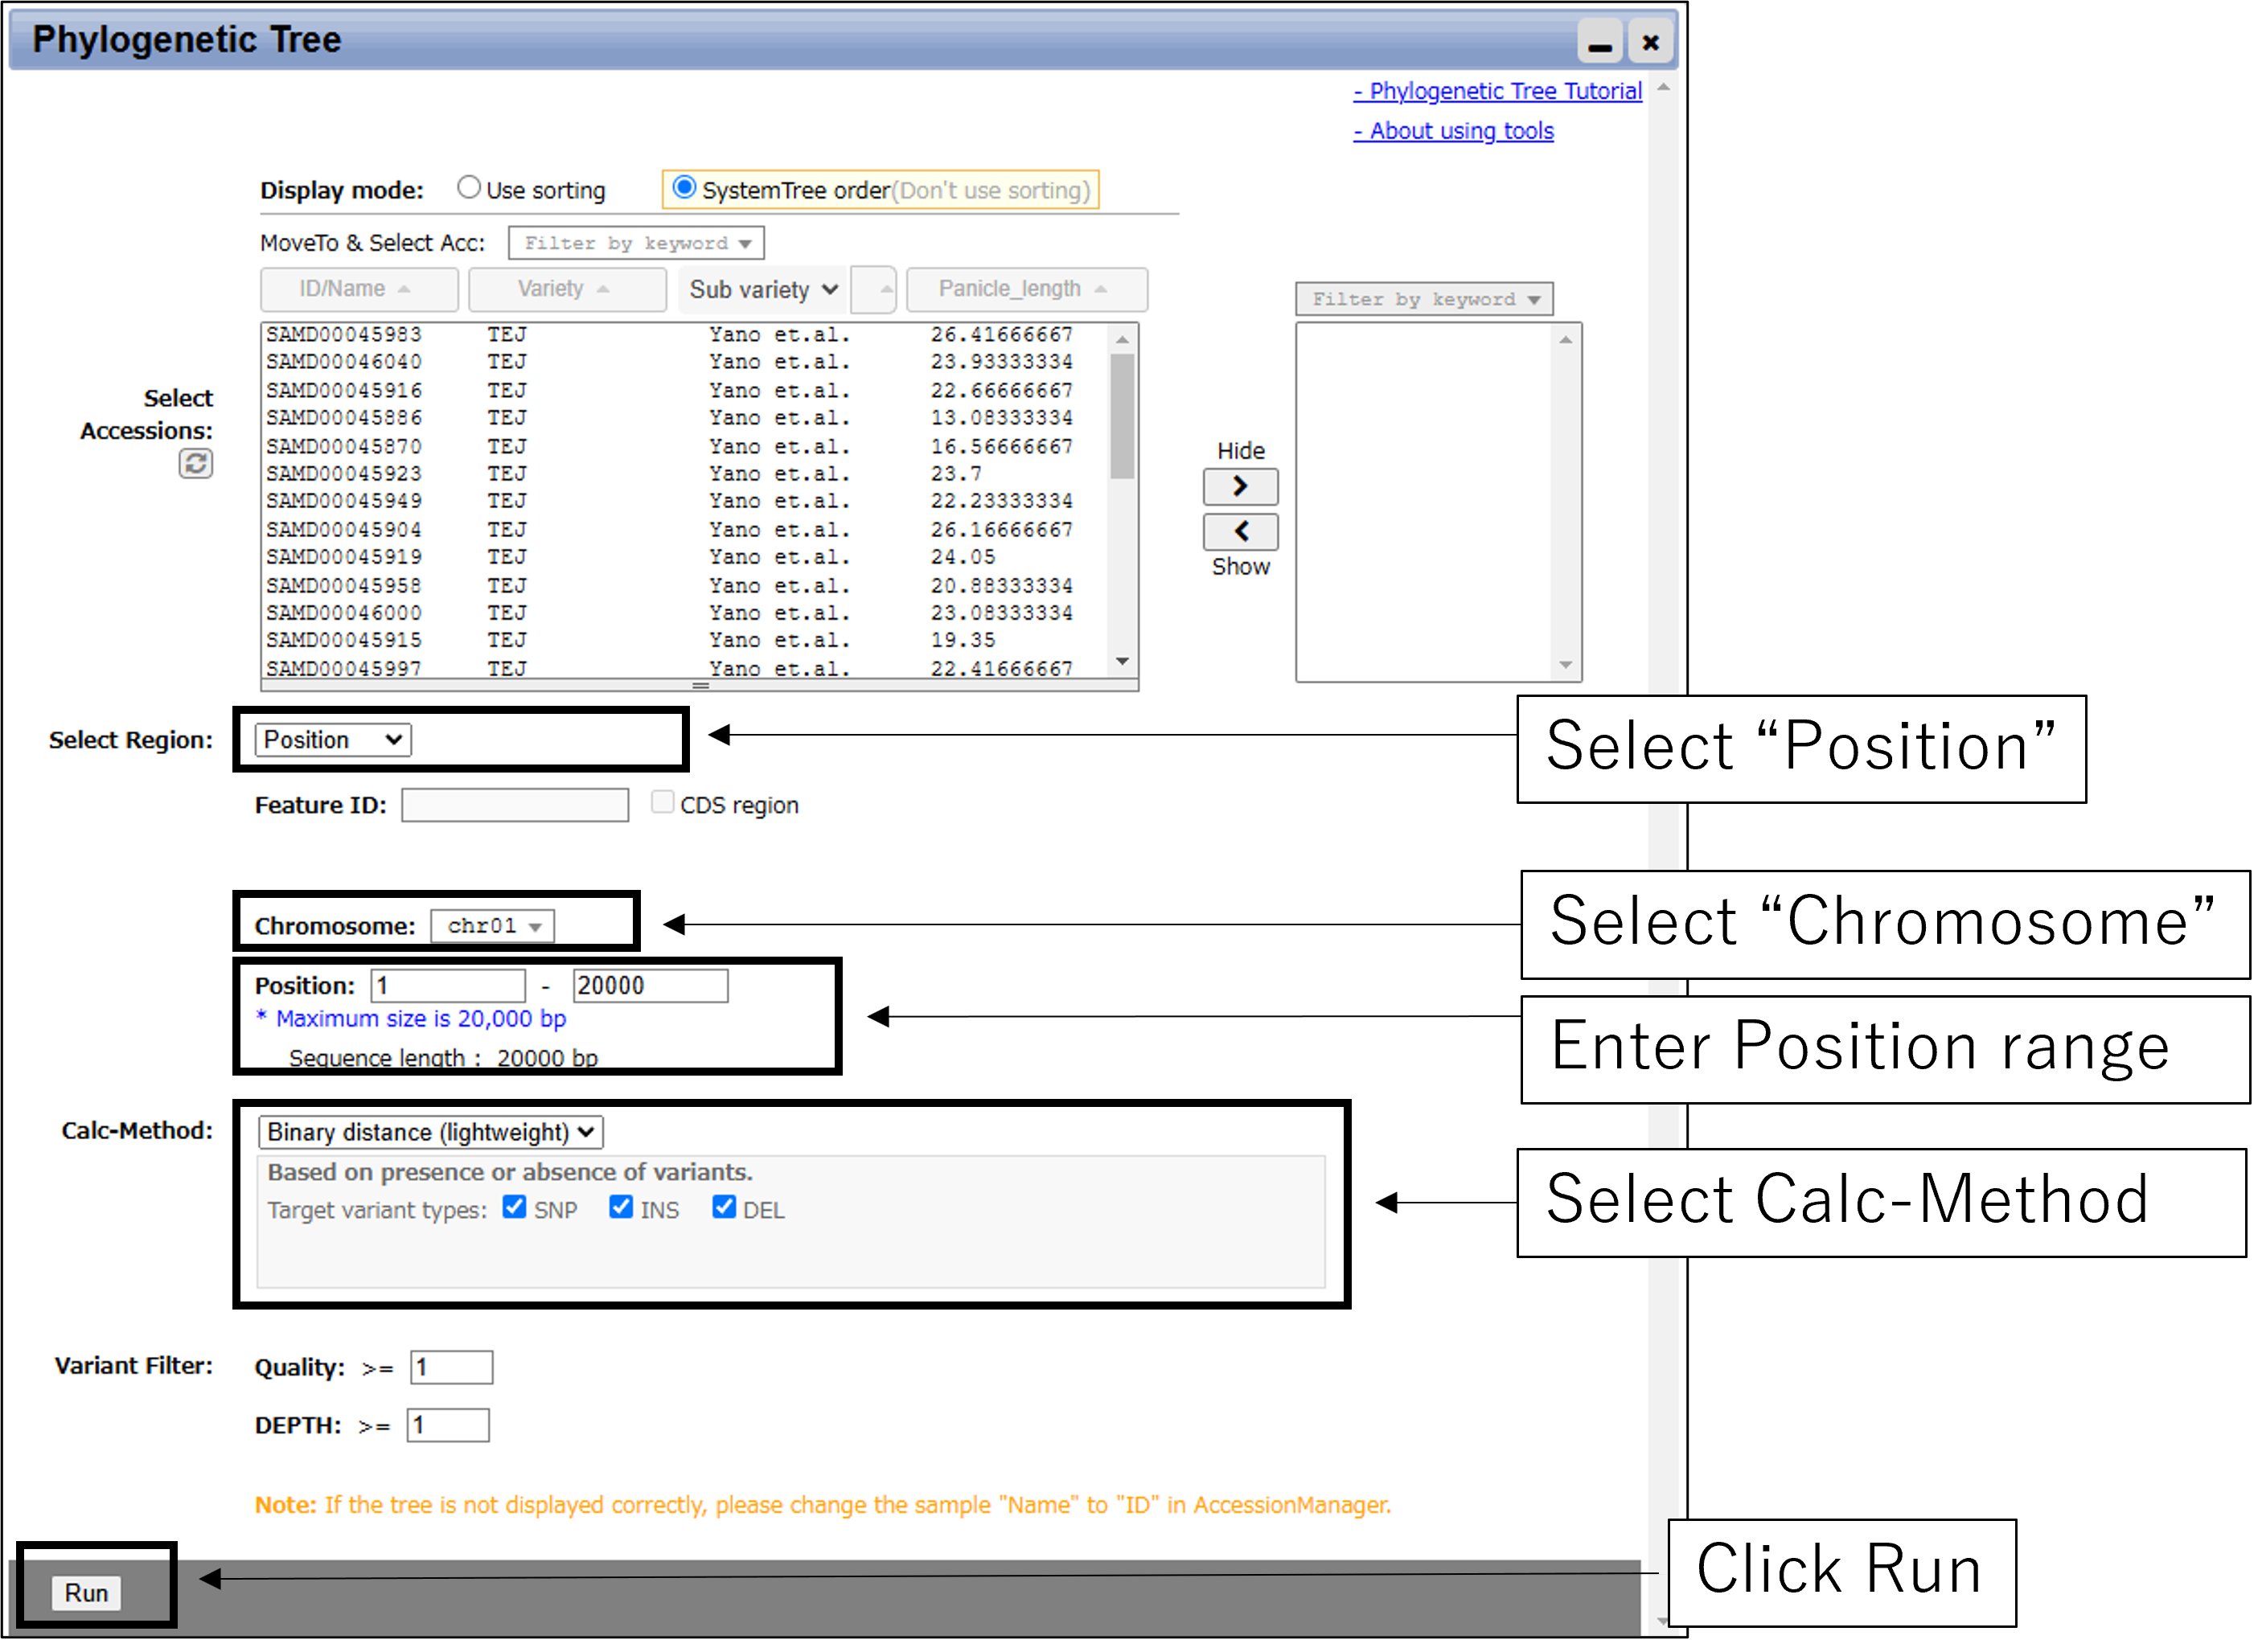
2.Parameter setting
If the accession name is set to "Name" display, the phylogenetic tree may not be displayed correctly. If so, change it to "ID" in the AccessionManager.
1.Open setting dialog
2.Parameter setting
2-1.Main settings(with Chromosome and Position)
2-2.Main settings(with GeneID)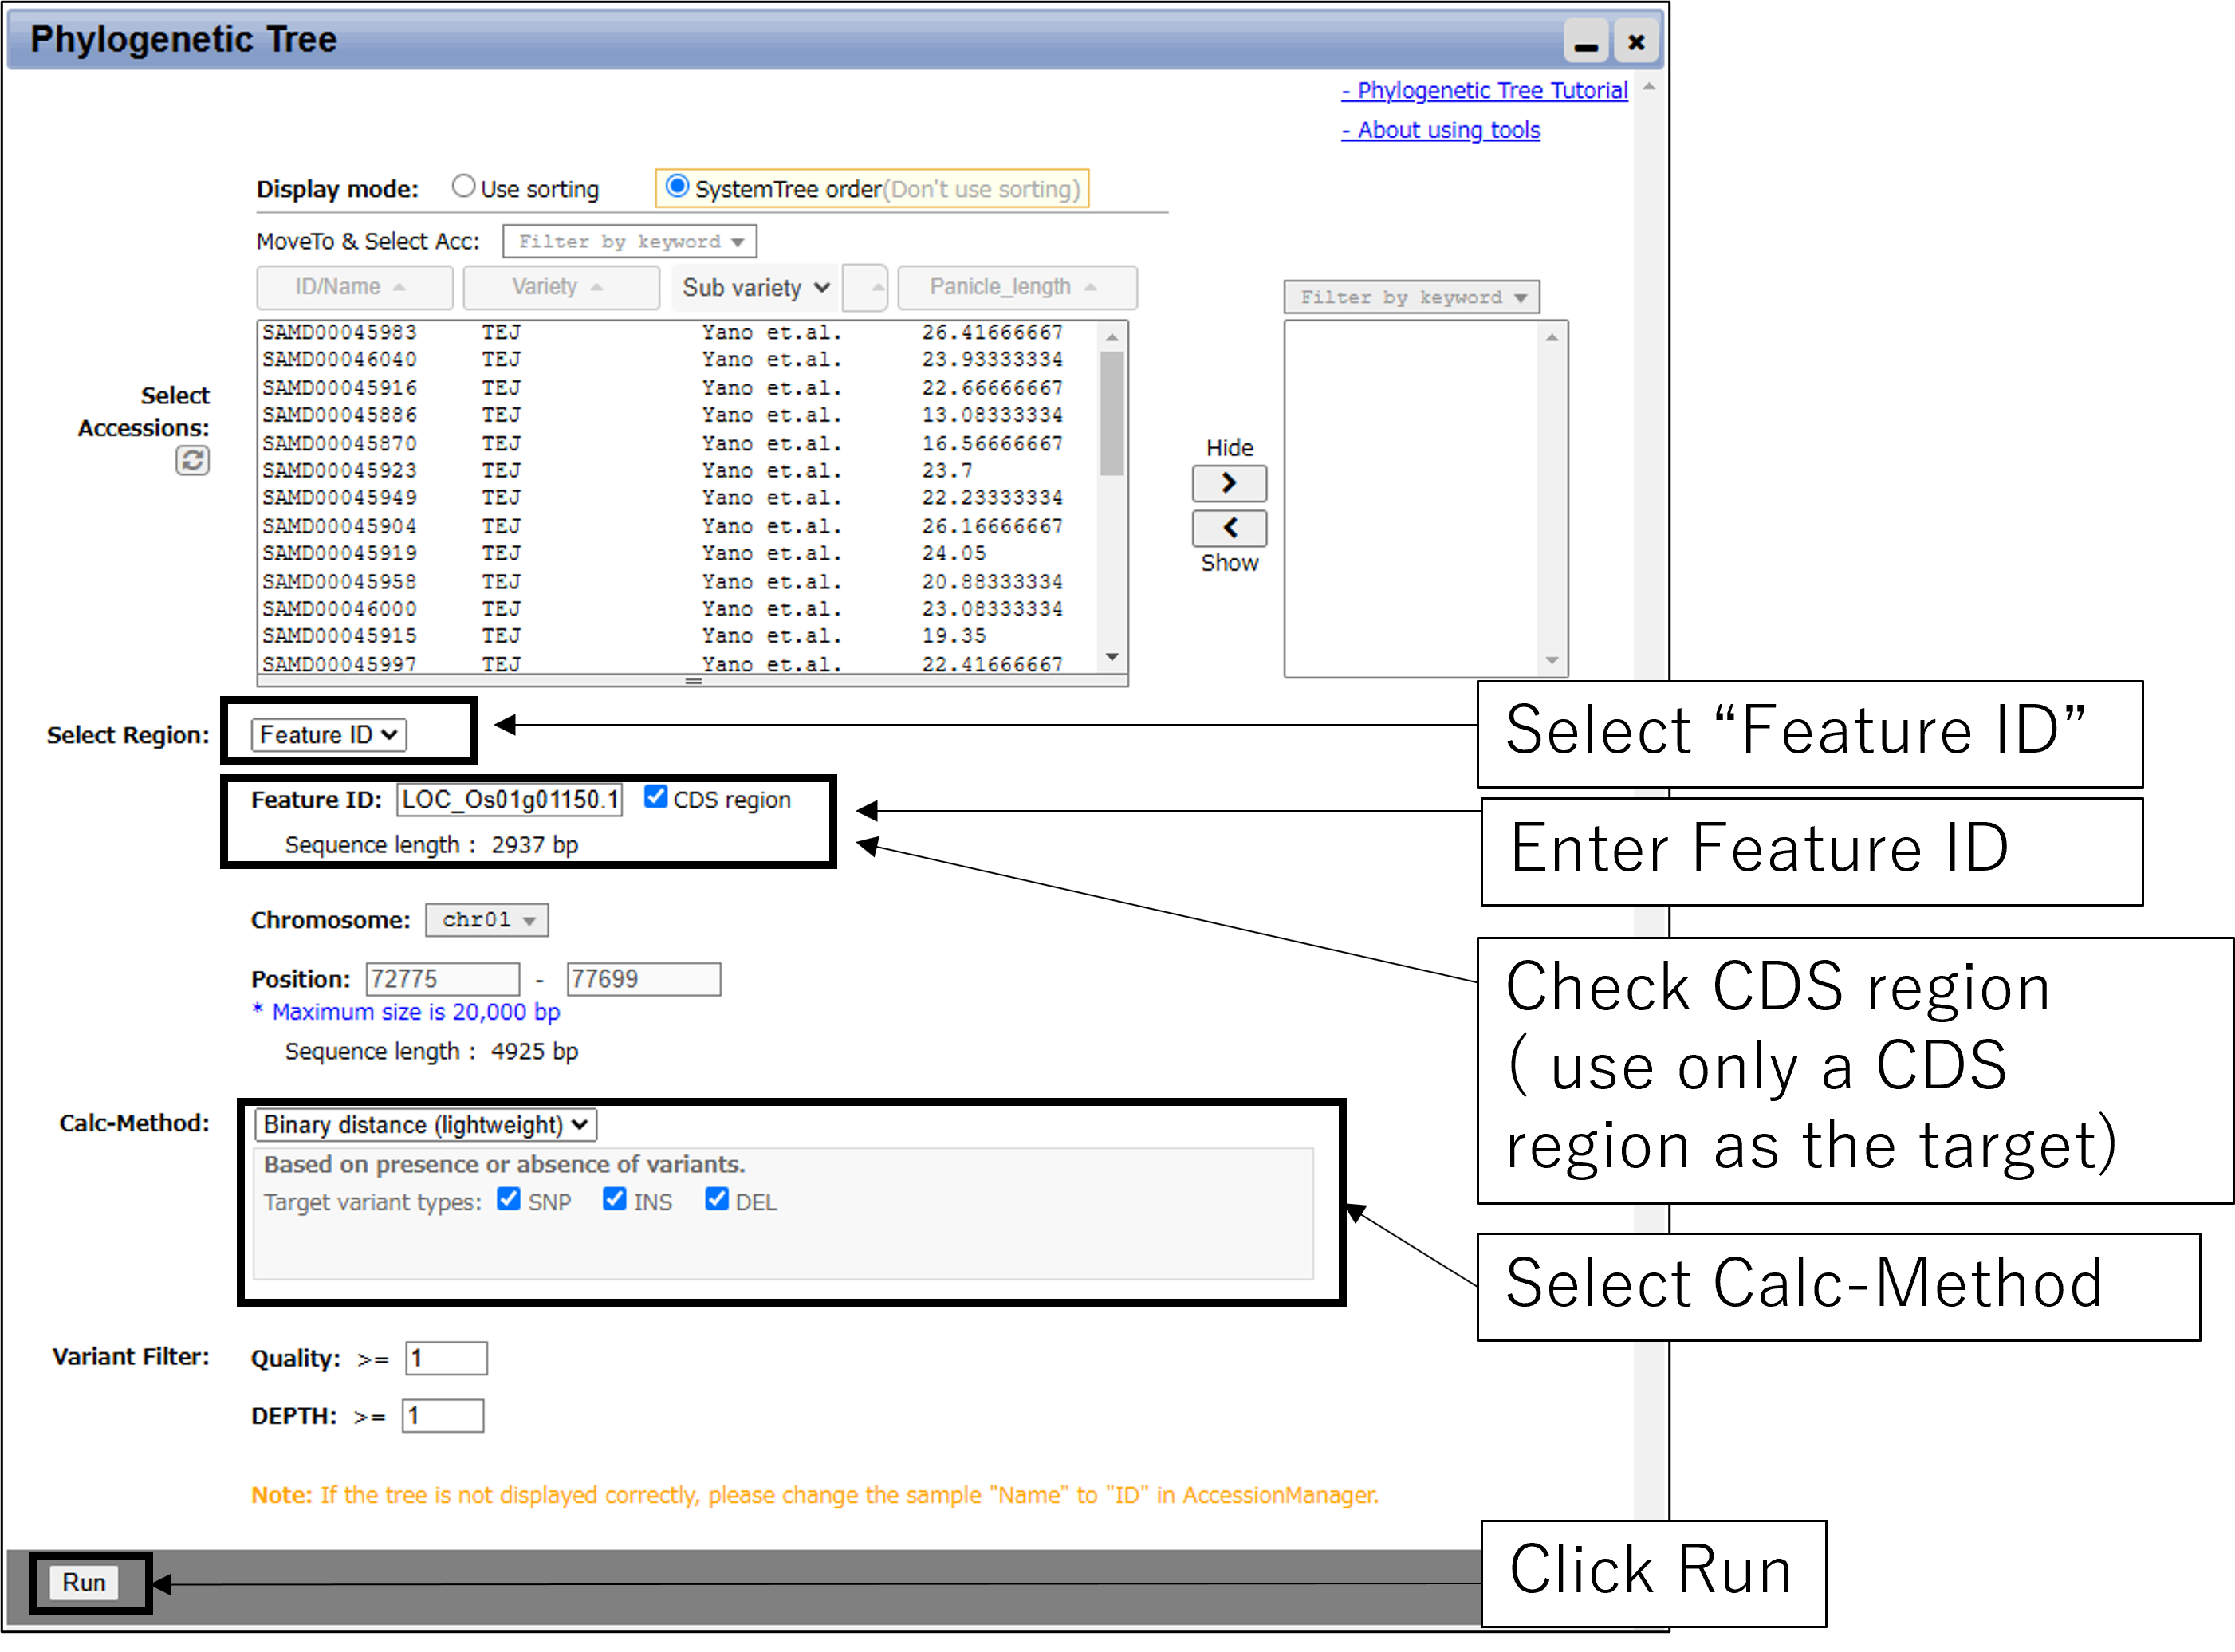
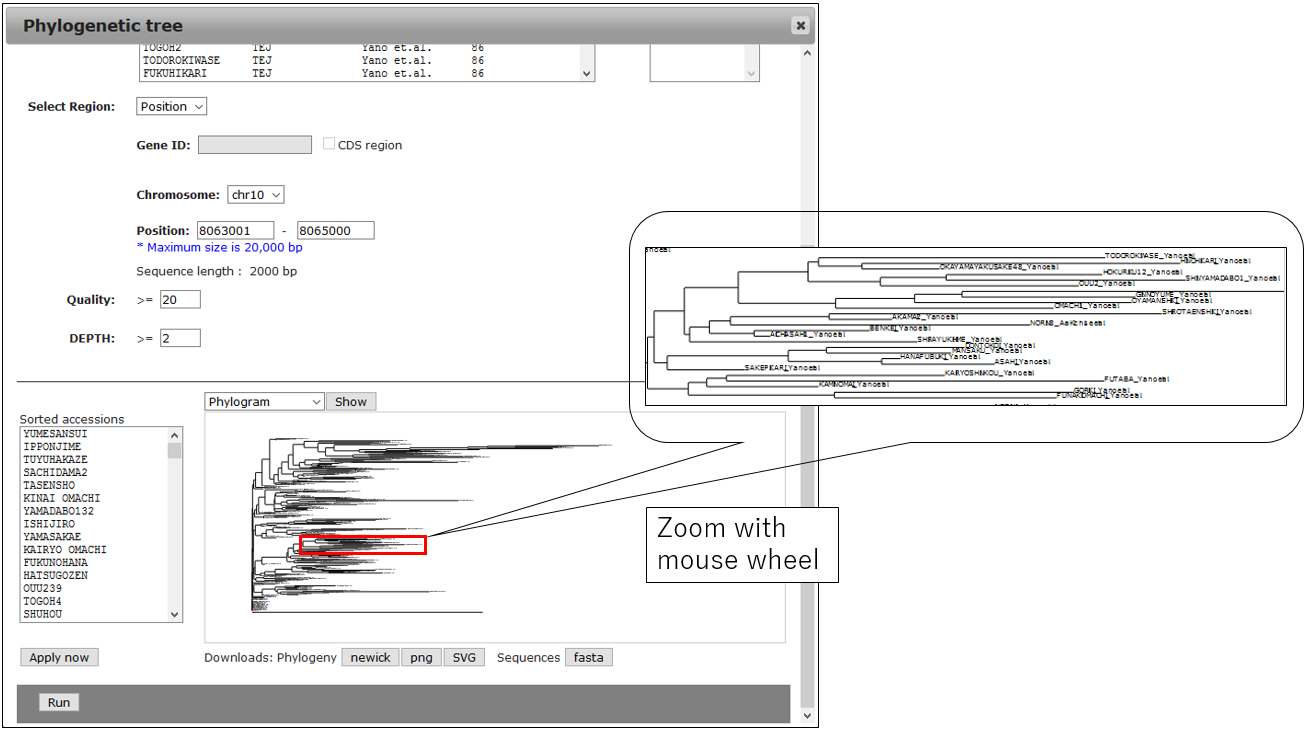
3.Result
2-2.Main settings(with GeneID)
3-1.Result
3-2.Change Circle phylogram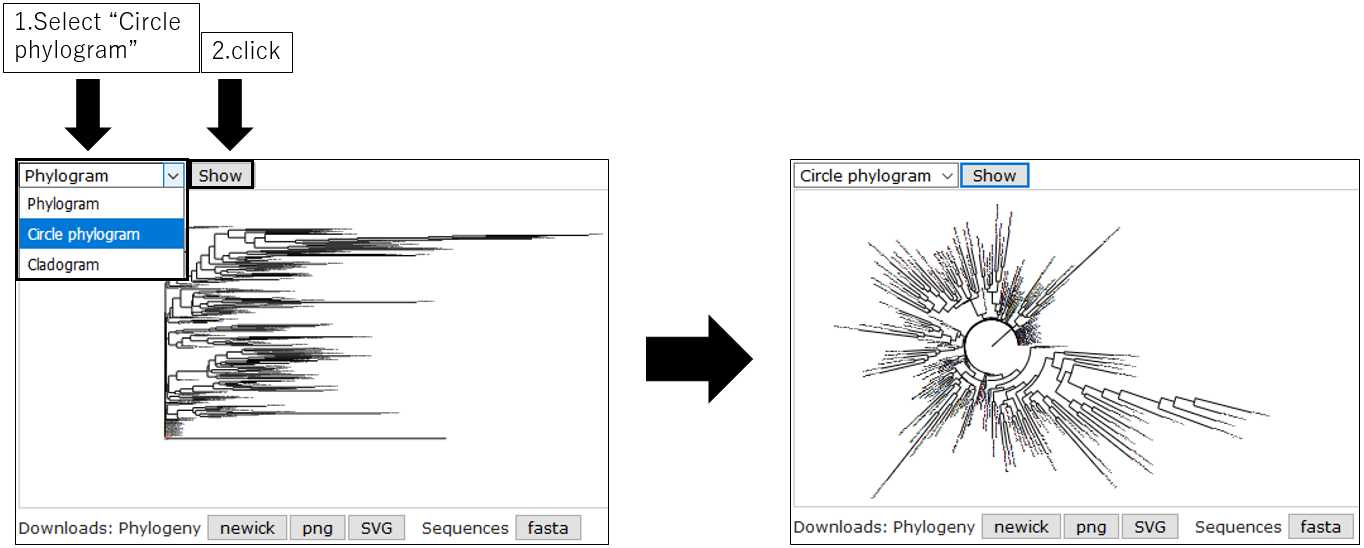
3-3.Change Cladogram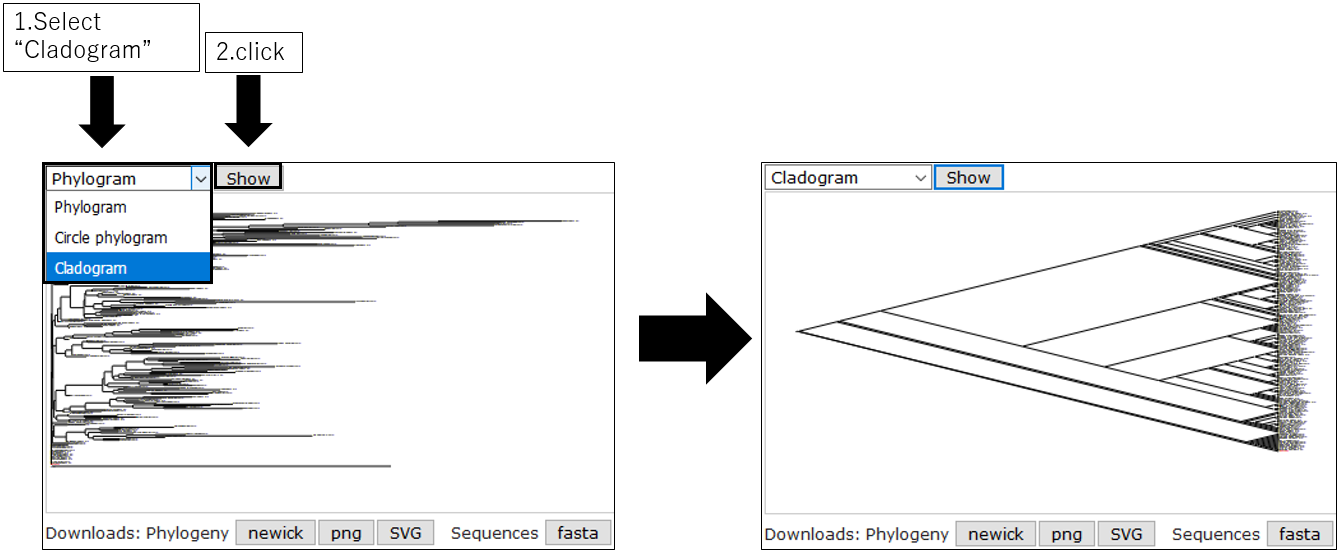
3-4.Sort snpblock table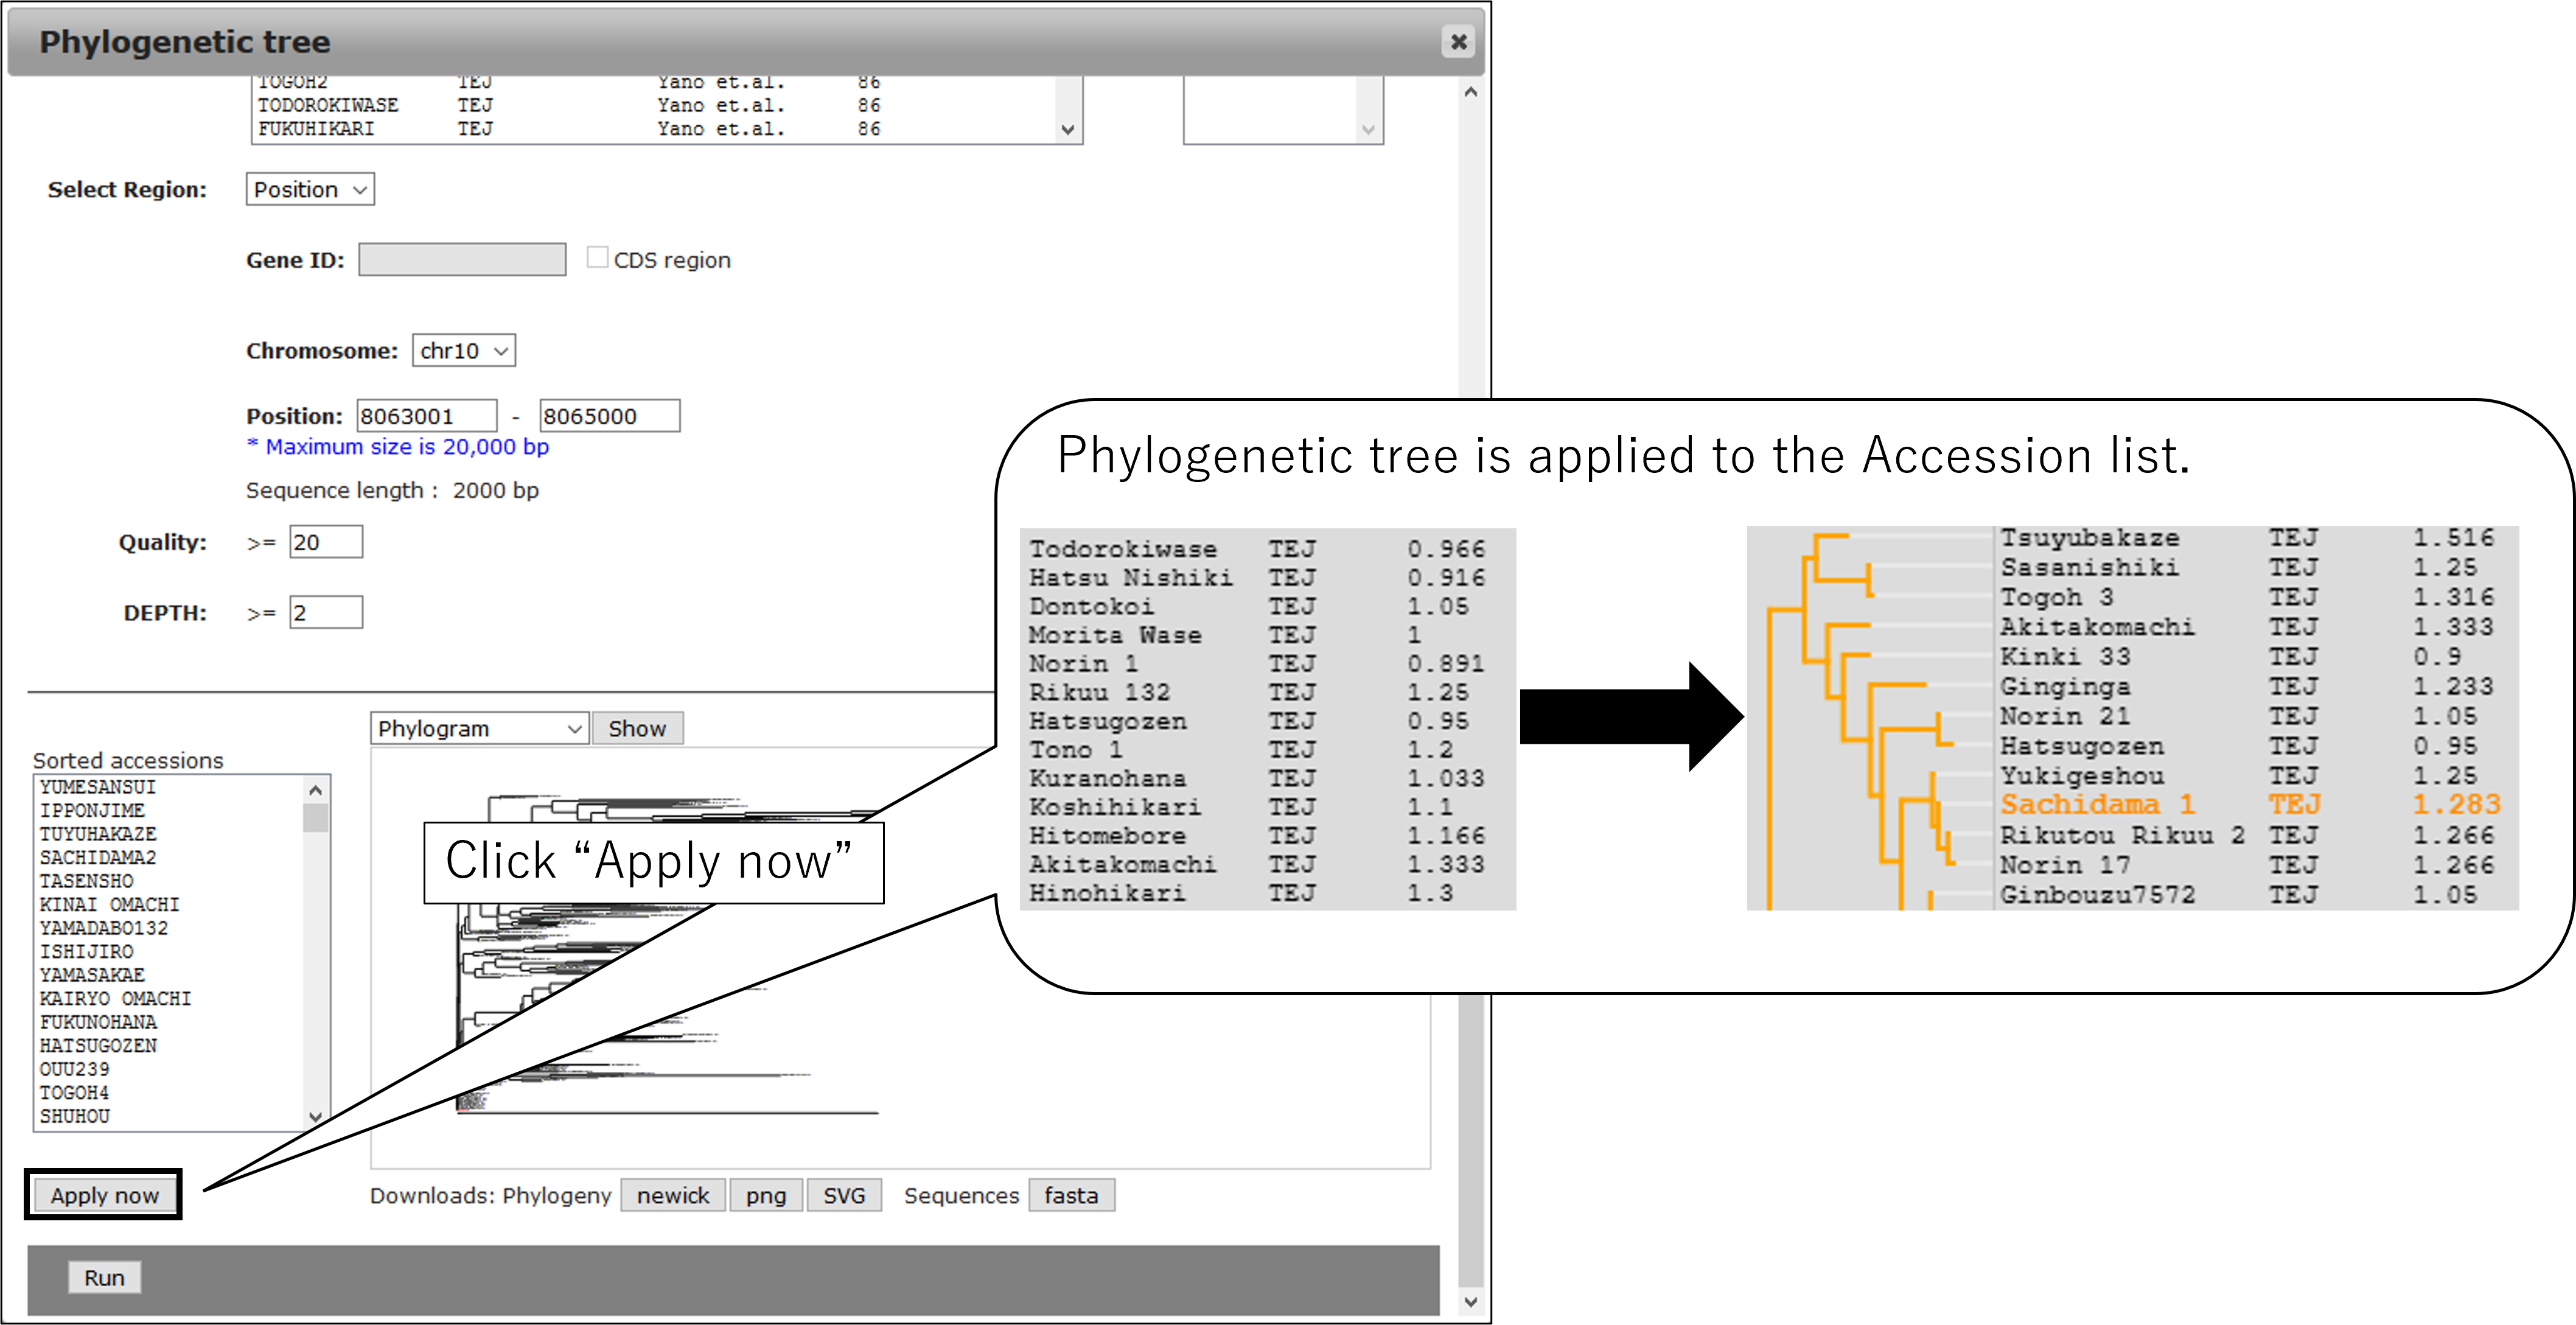
3-5.Download tree data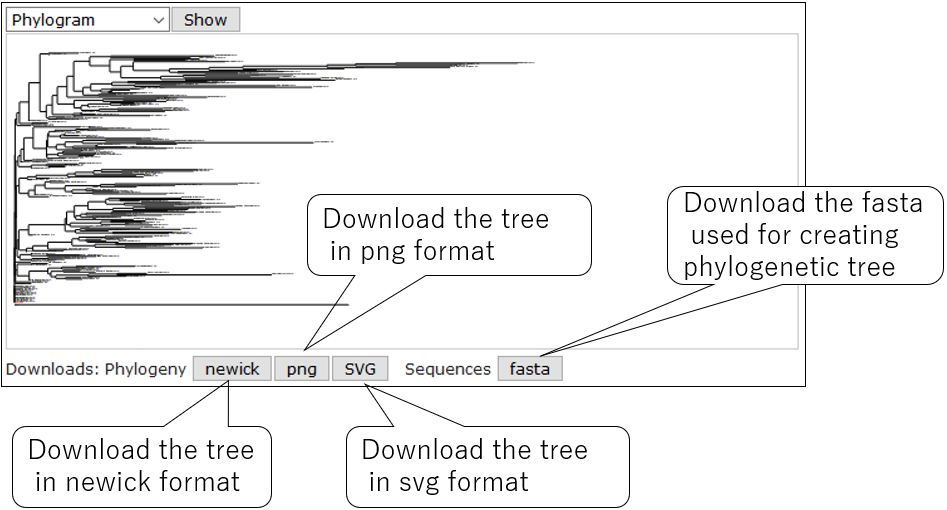
3-6.Select Accession (option)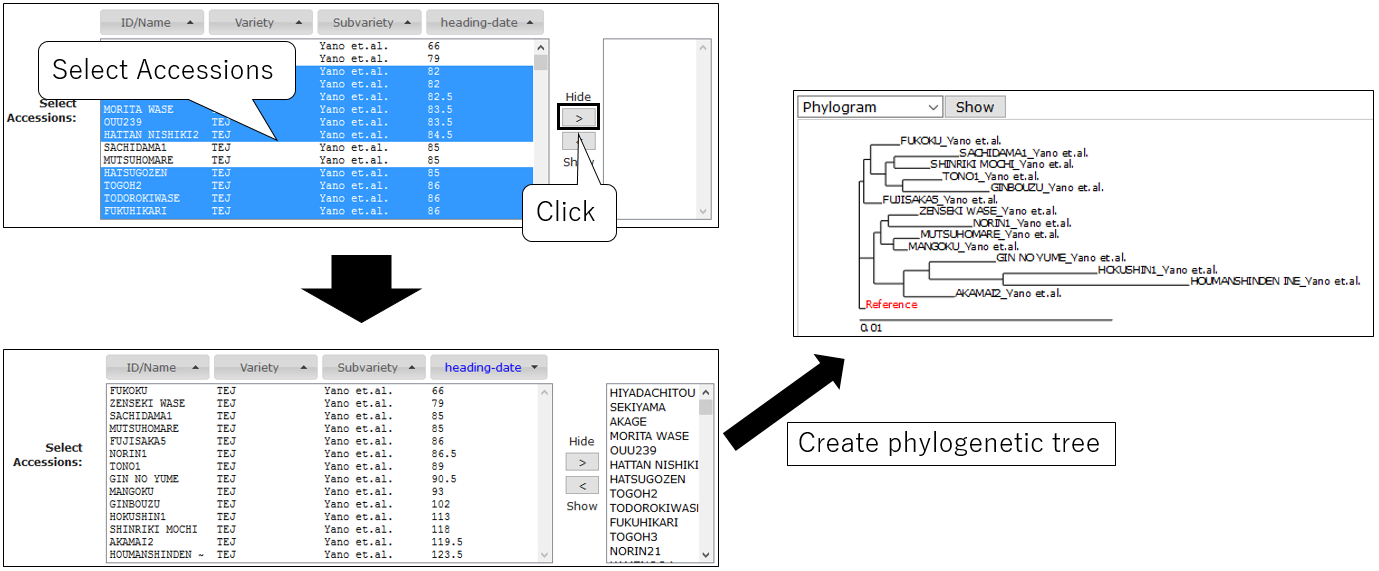
3-2.Change Circle phylogram
3-3.Change Cladogram
3-4.Sort snpblock table
3-5.Download tree data
3-6.Select Accession (option)
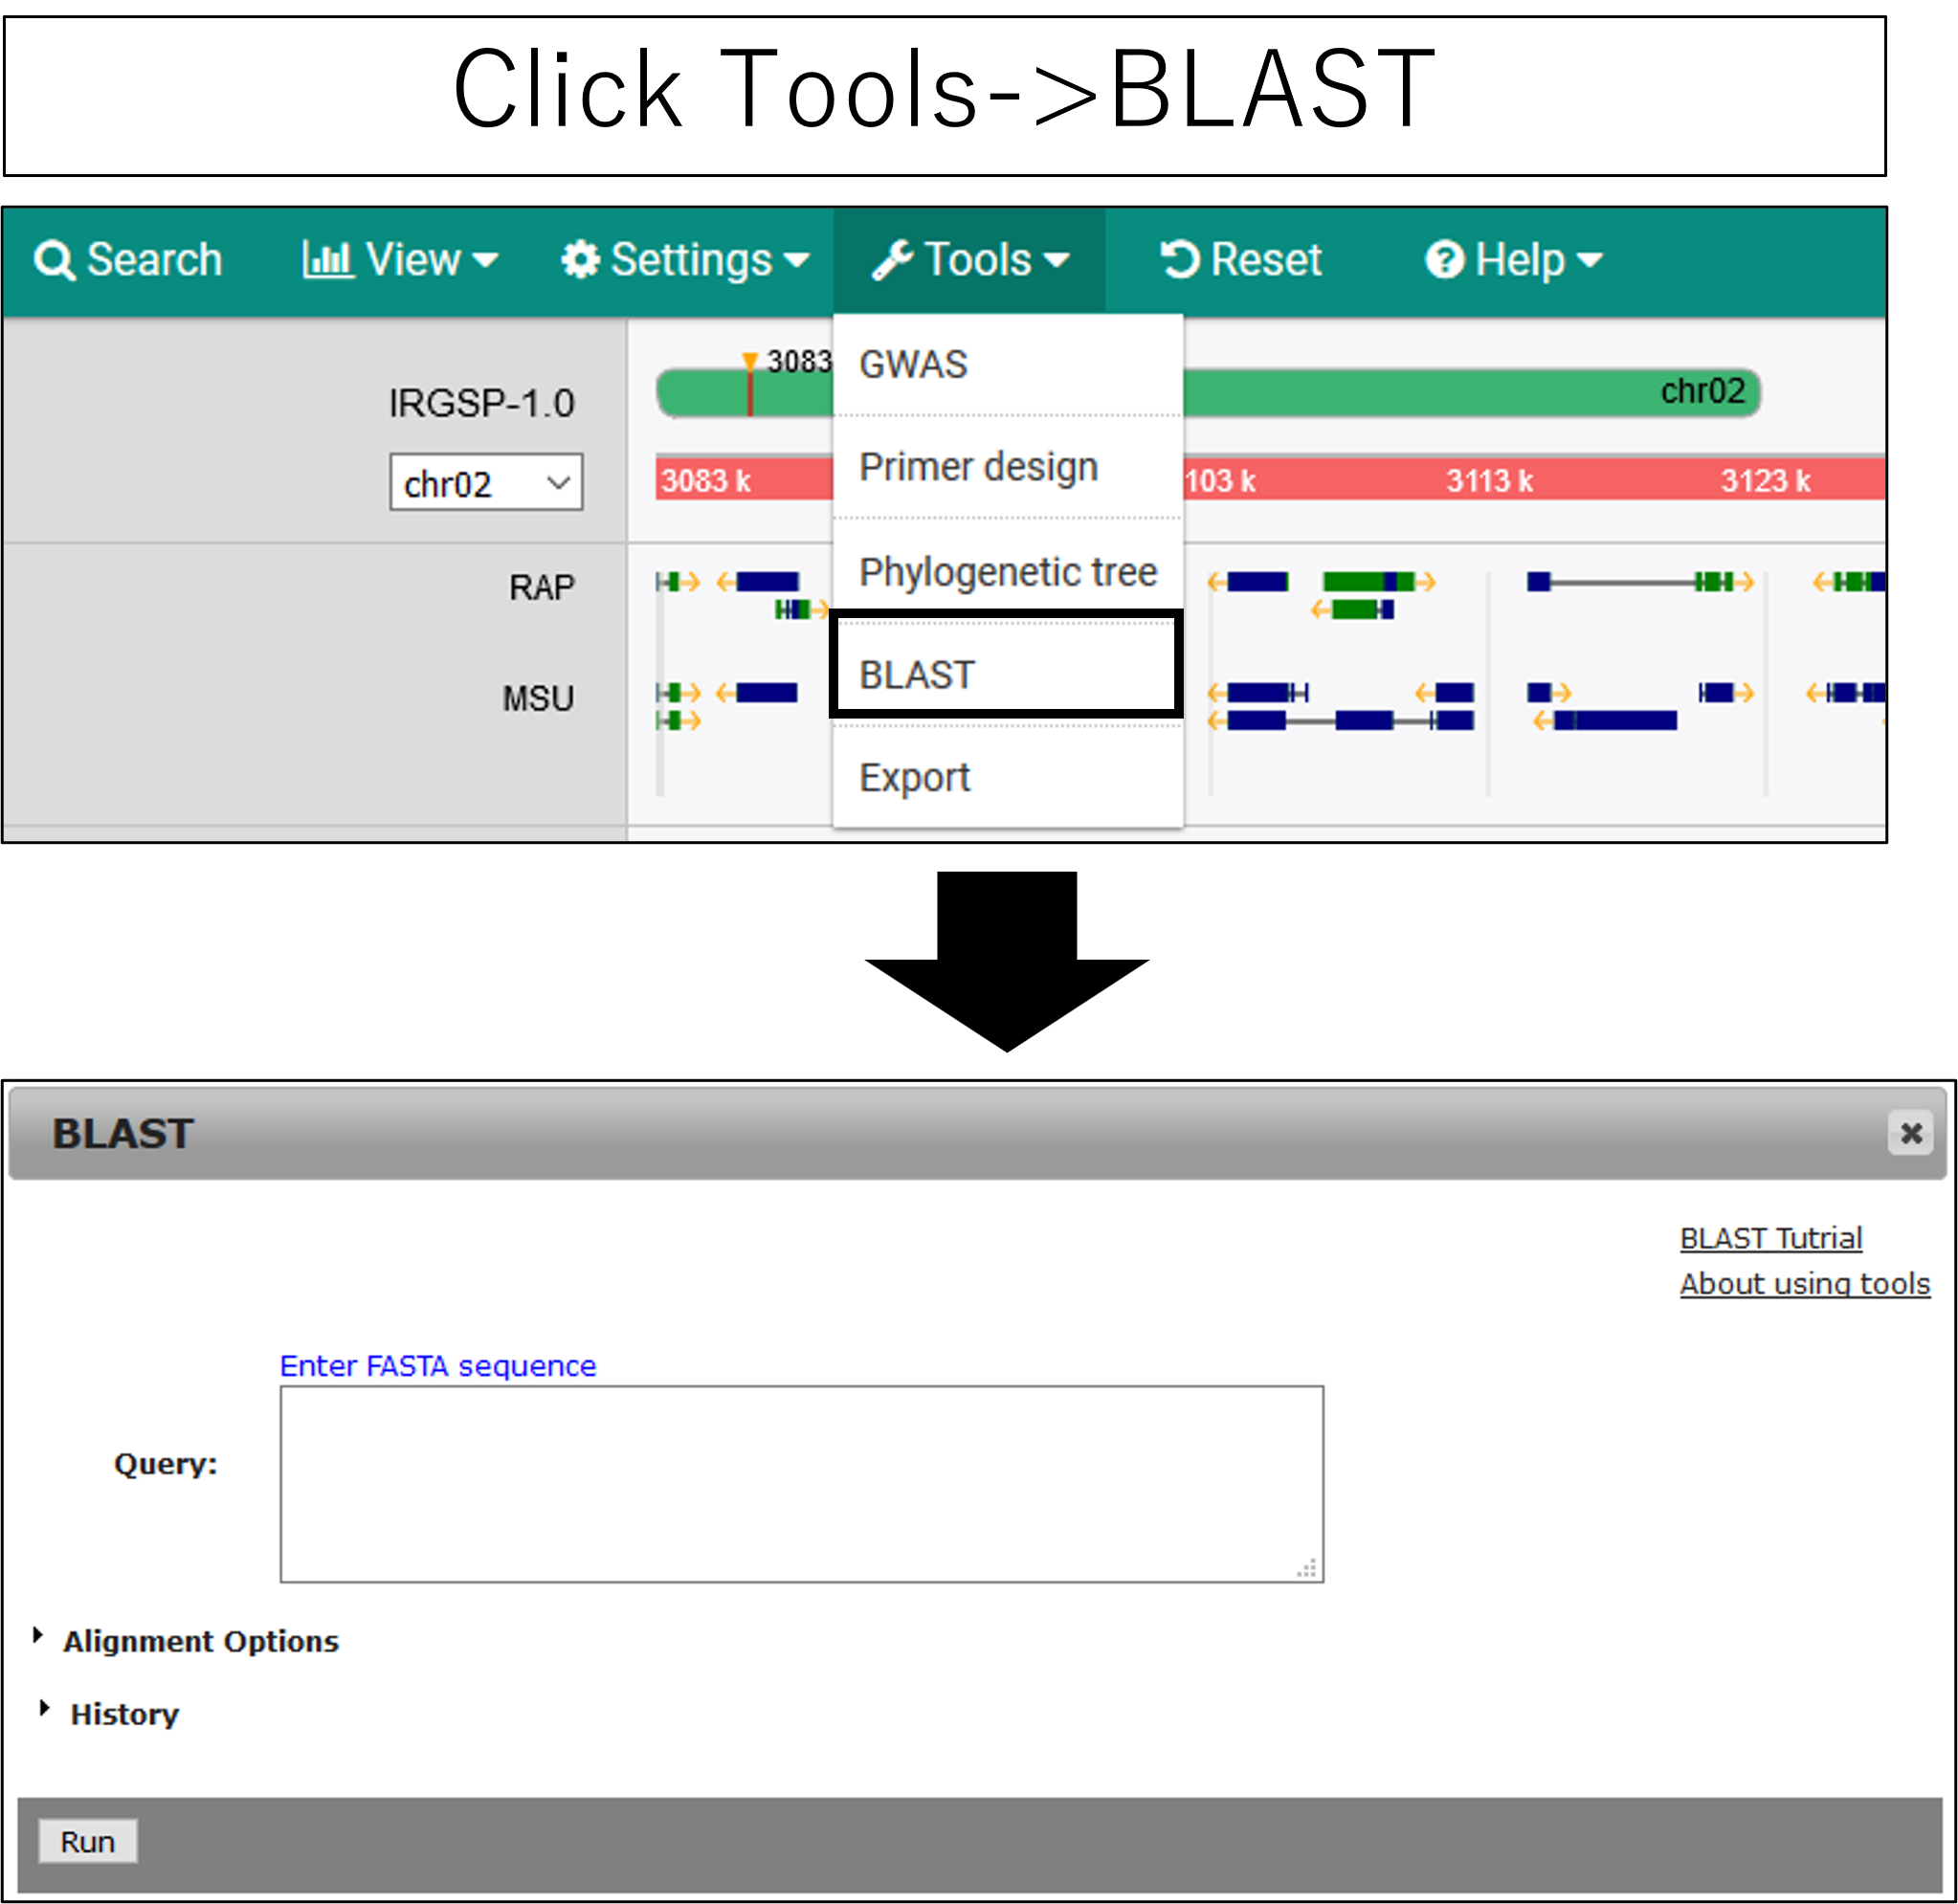
BLAST
1.Open setting dialog
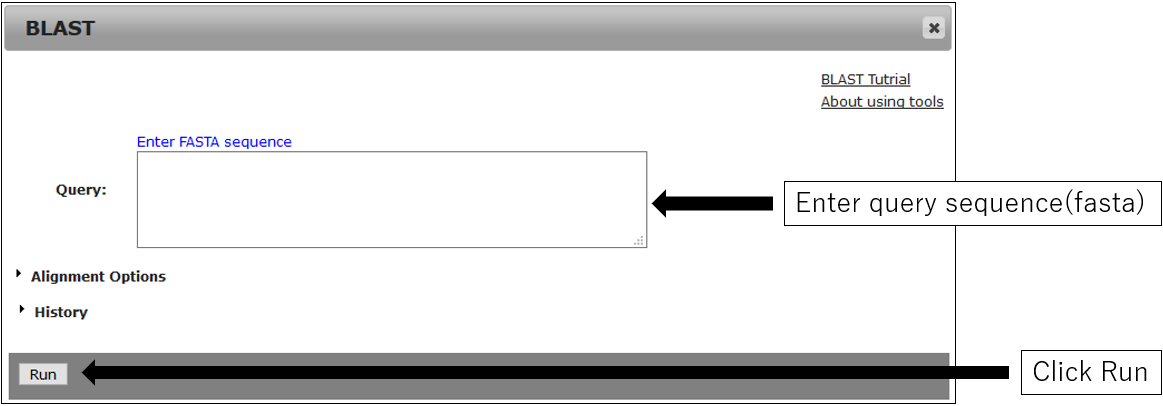
2.Parameter setting
1.Open setting dialog
2.Parameter setting
2-1.Main settings
2-2.Alignment Options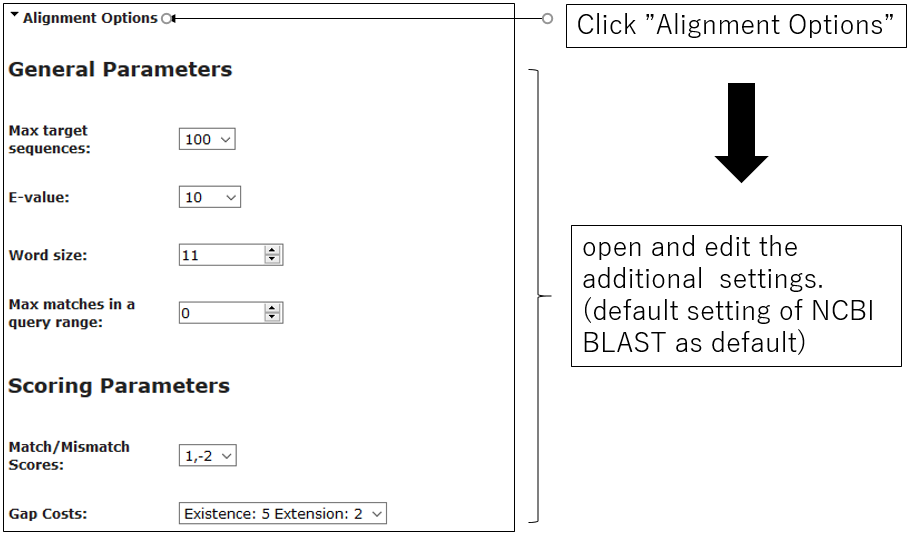
3.Result
2-2.Alignment Options
3-1.Result
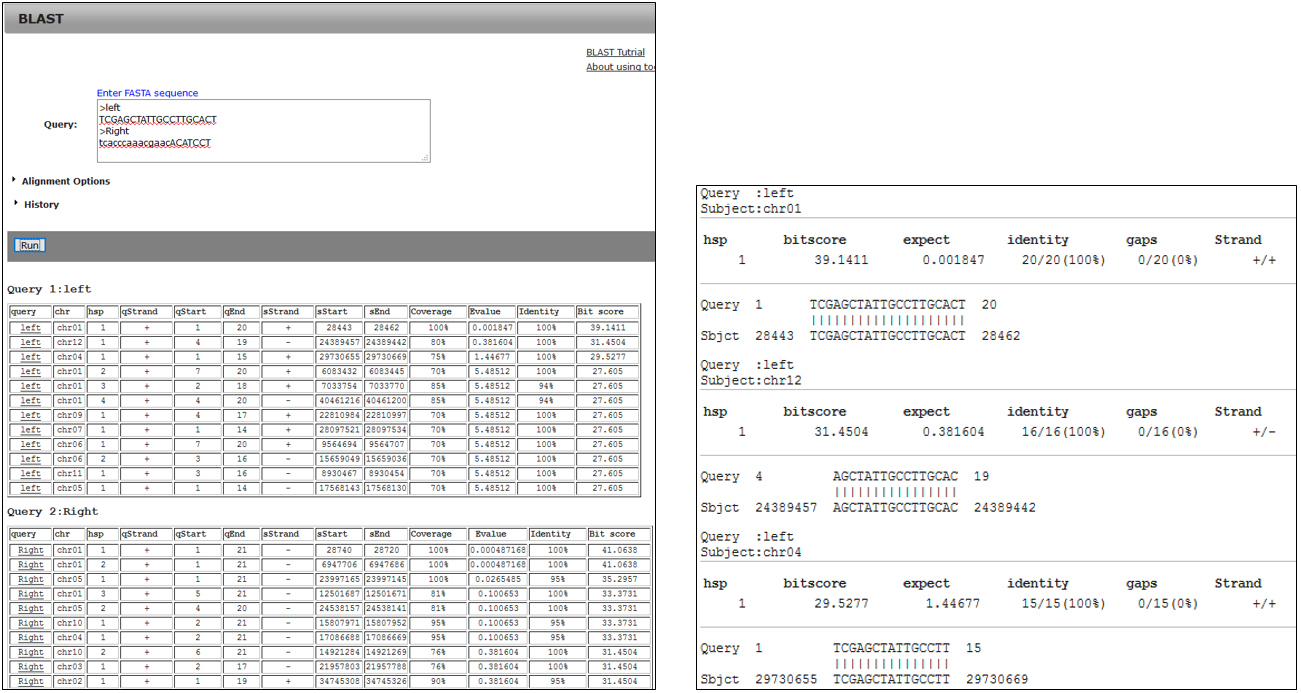
3-2.BLAST result using primer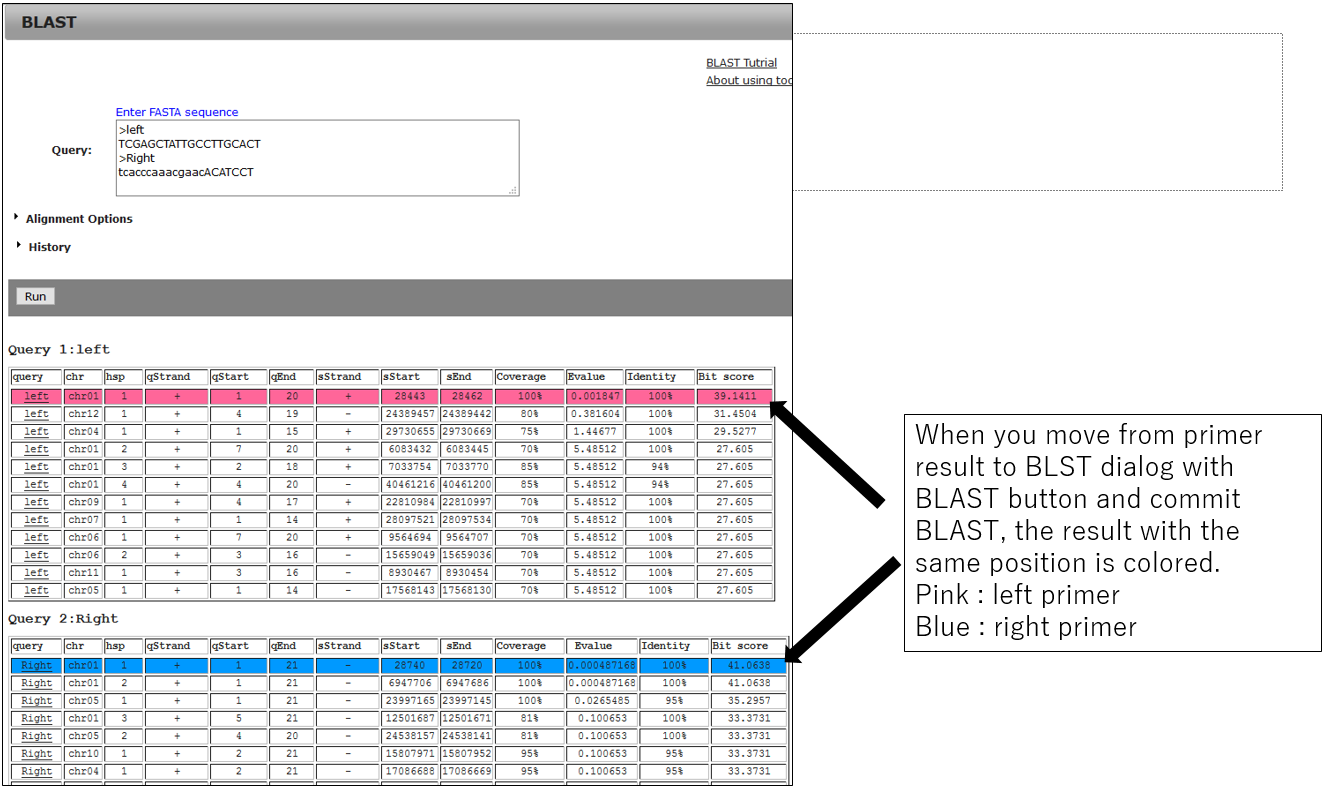
3-3.Jump alignment section of BLAST result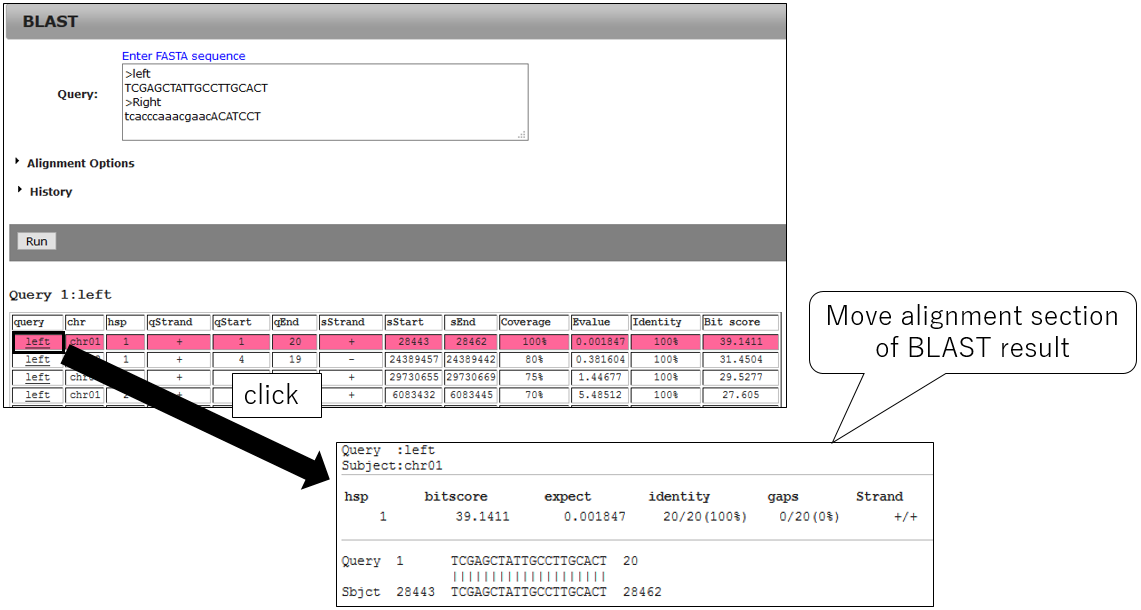
3-2.BLAST result using primer
3-3.Jump alignment section of BLAST result
GWAS
1.Open GWAS dialog
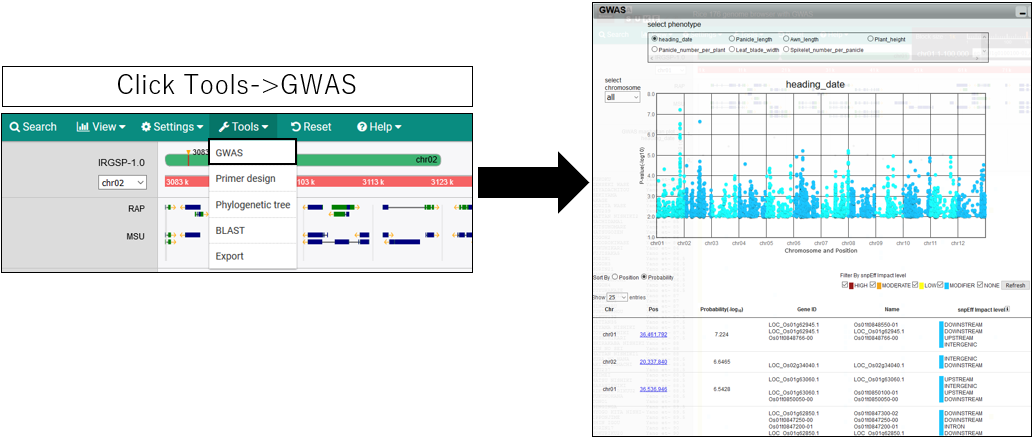
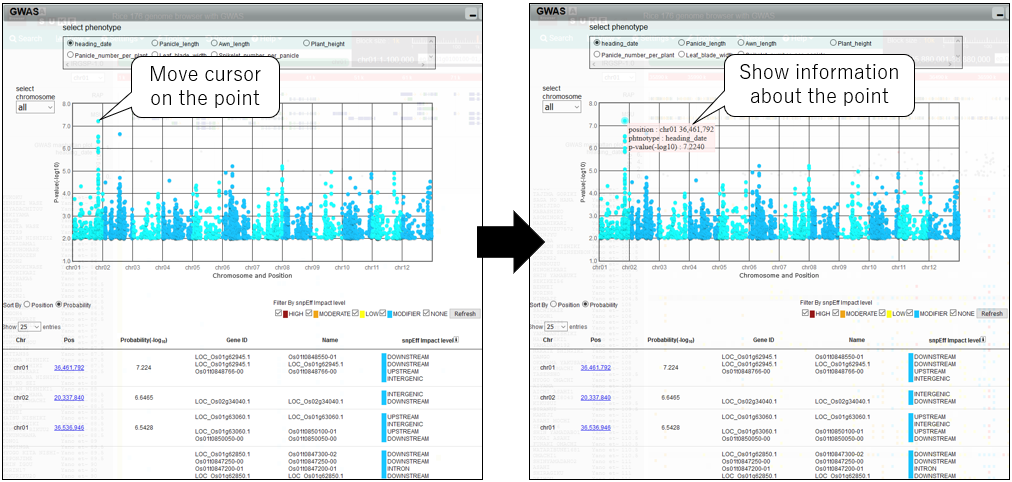
2.Show information
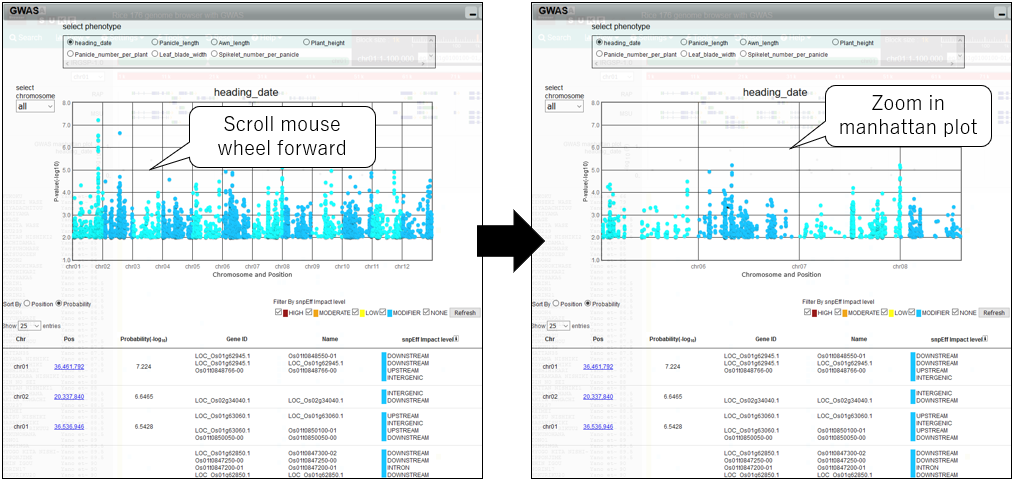
3.Zoom in manhattan plot
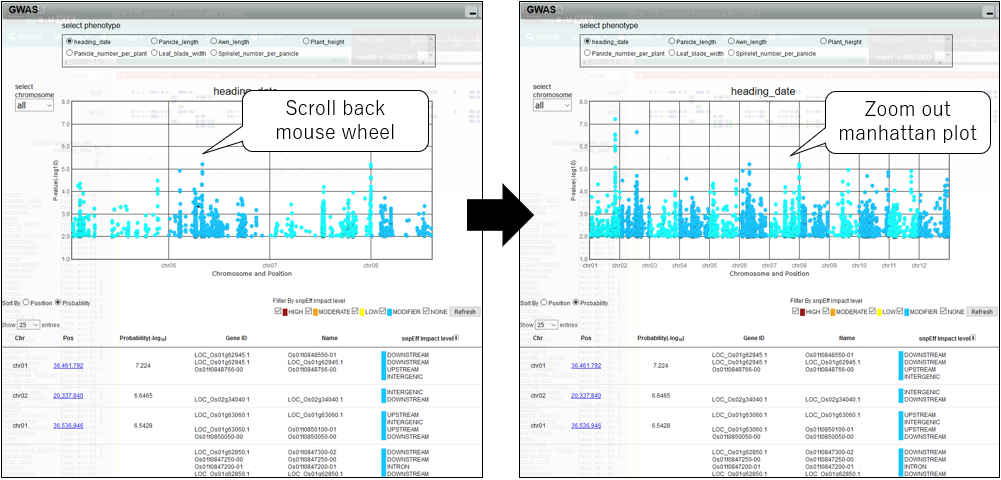
4.Zoom out manhattan plot
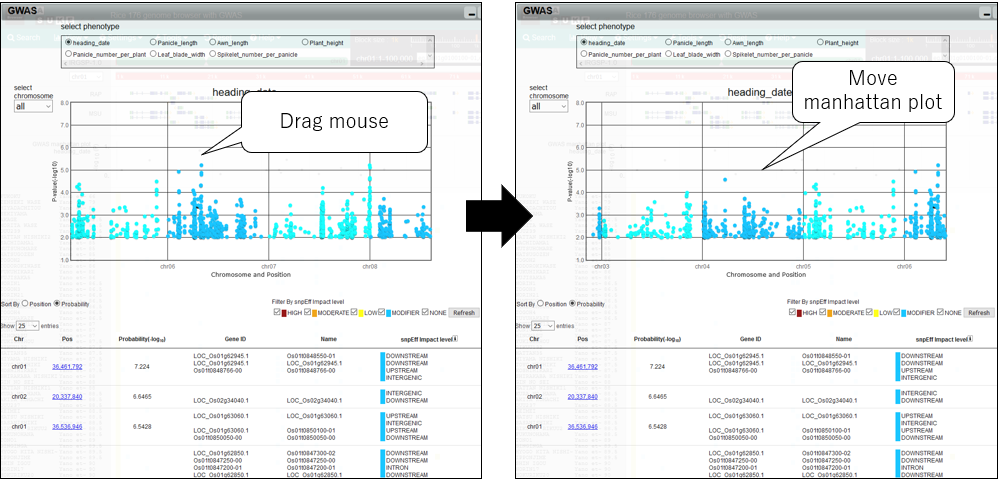
5.Pan manhattan plot
6.Change chromosome
7.Change phenotype
8.Filter By SnpEff impact
9.Sort By Position
10.Move postiion on GWAS plot
11.Move postiion on variant list
1.Open GWAS dialog
2.Show information
3.Zoom in manhattan plot
4.Zoom out manhattan plot
5.Pan manhattan plot
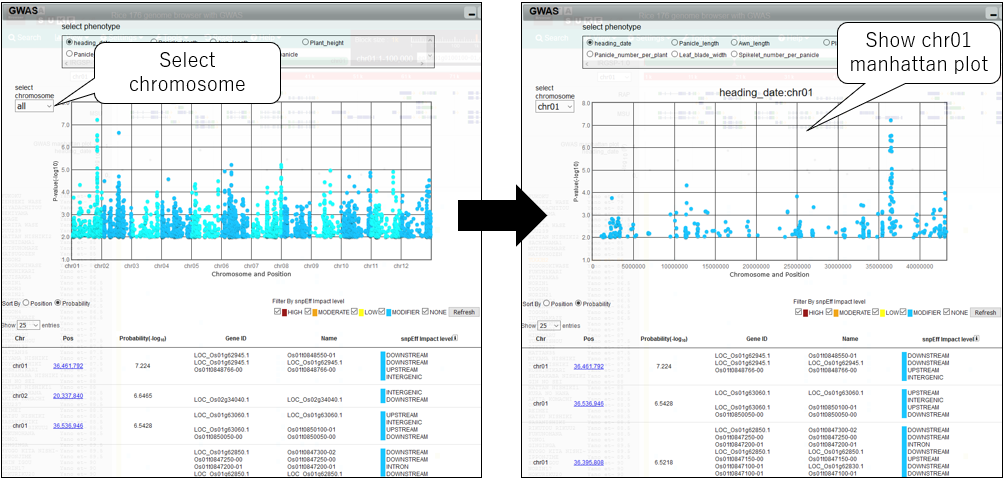
6.Change chromosome
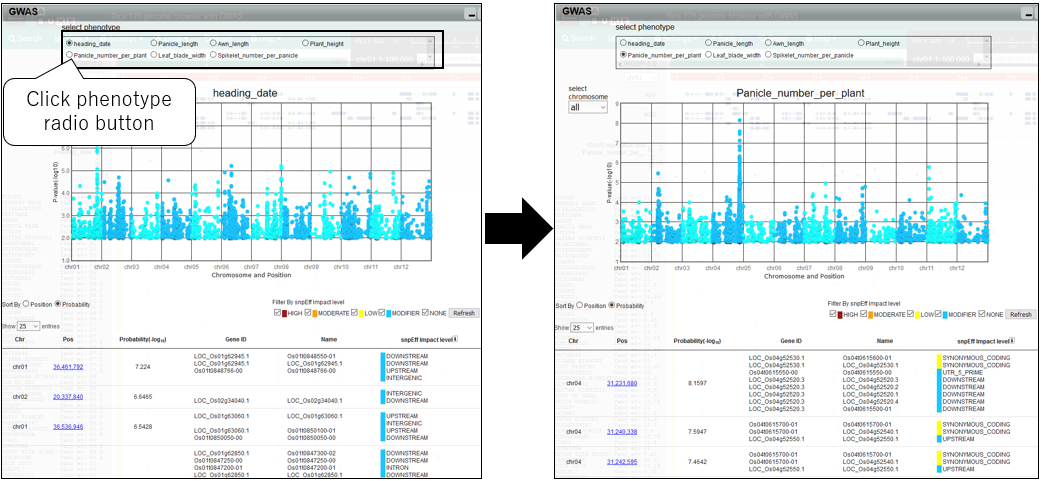
7.Change phenotype
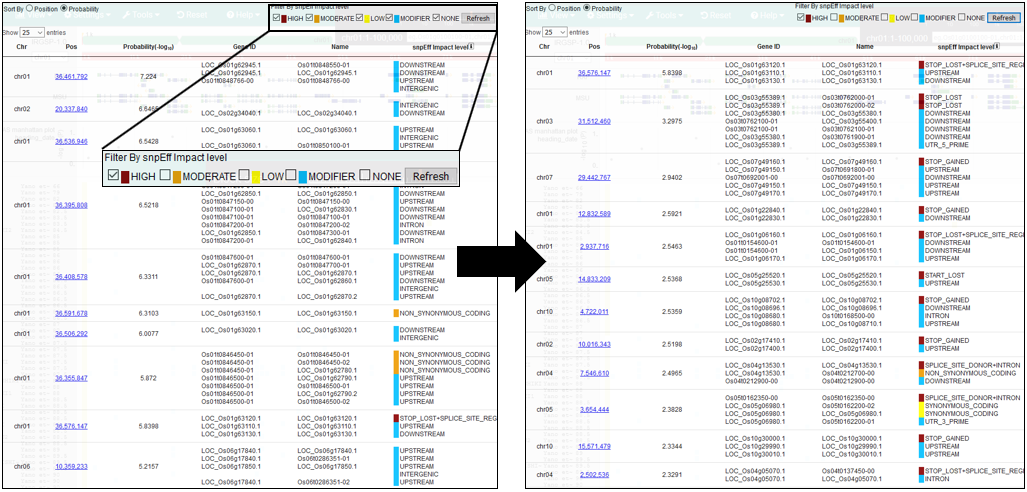
8.Filter By SnpEff impact
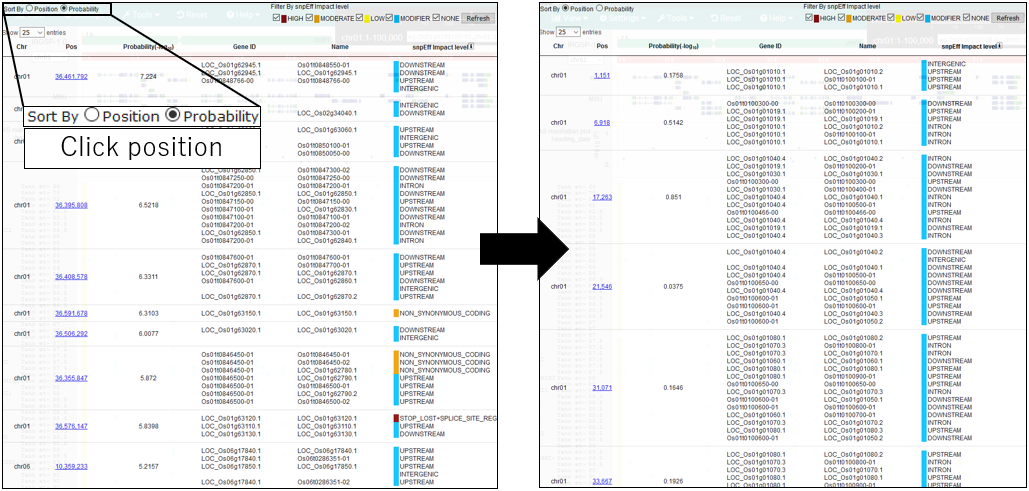
9.Sort By Position
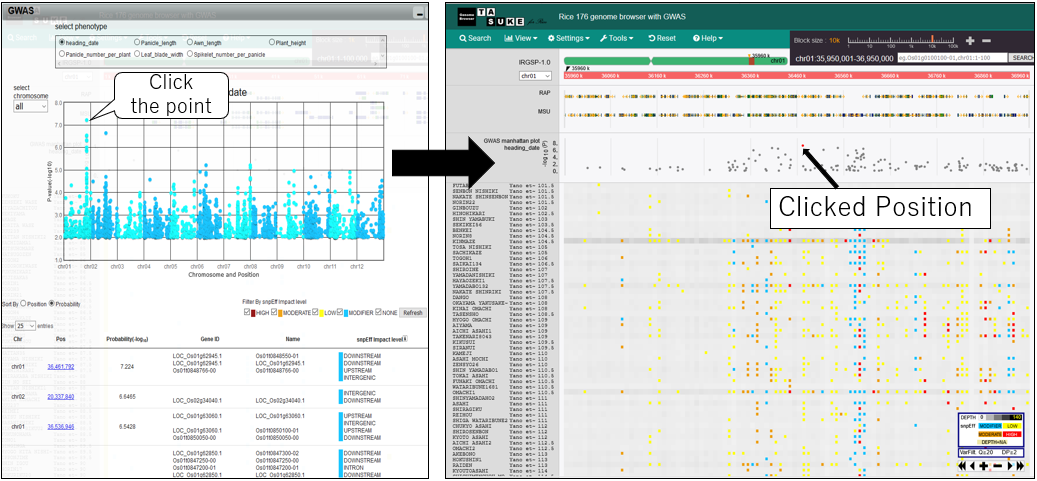
10.Move postiion on GWAS plot
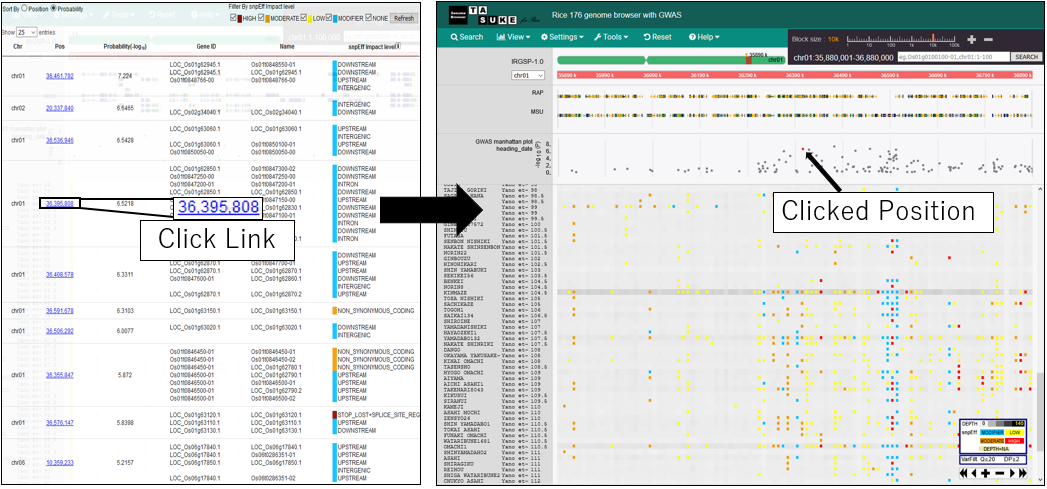
11.Move postiion on variant list
Macro viewer
The Macro Viewer provides an overview of the TASUKE dataset by multiple genomic analysis.
Mode1: ADMIXTURE
Displays the ancestry fraction (Q matrices) of ADMIXTURE results as bar plots. Results for multiple K (number of population assumed) can be shown in parallel.
Mode2,3: Variant count / Variant count (Impact = High)
Displays variant density across the genome as a heatmap with windows (fixed size e.g., 100kb). Variant count (Impact = High) mode shows high-impact variants predicted by SnpEff.
Mode4: PCA
Displays a two-dimensional scatter plot from principal component analysis (PCA).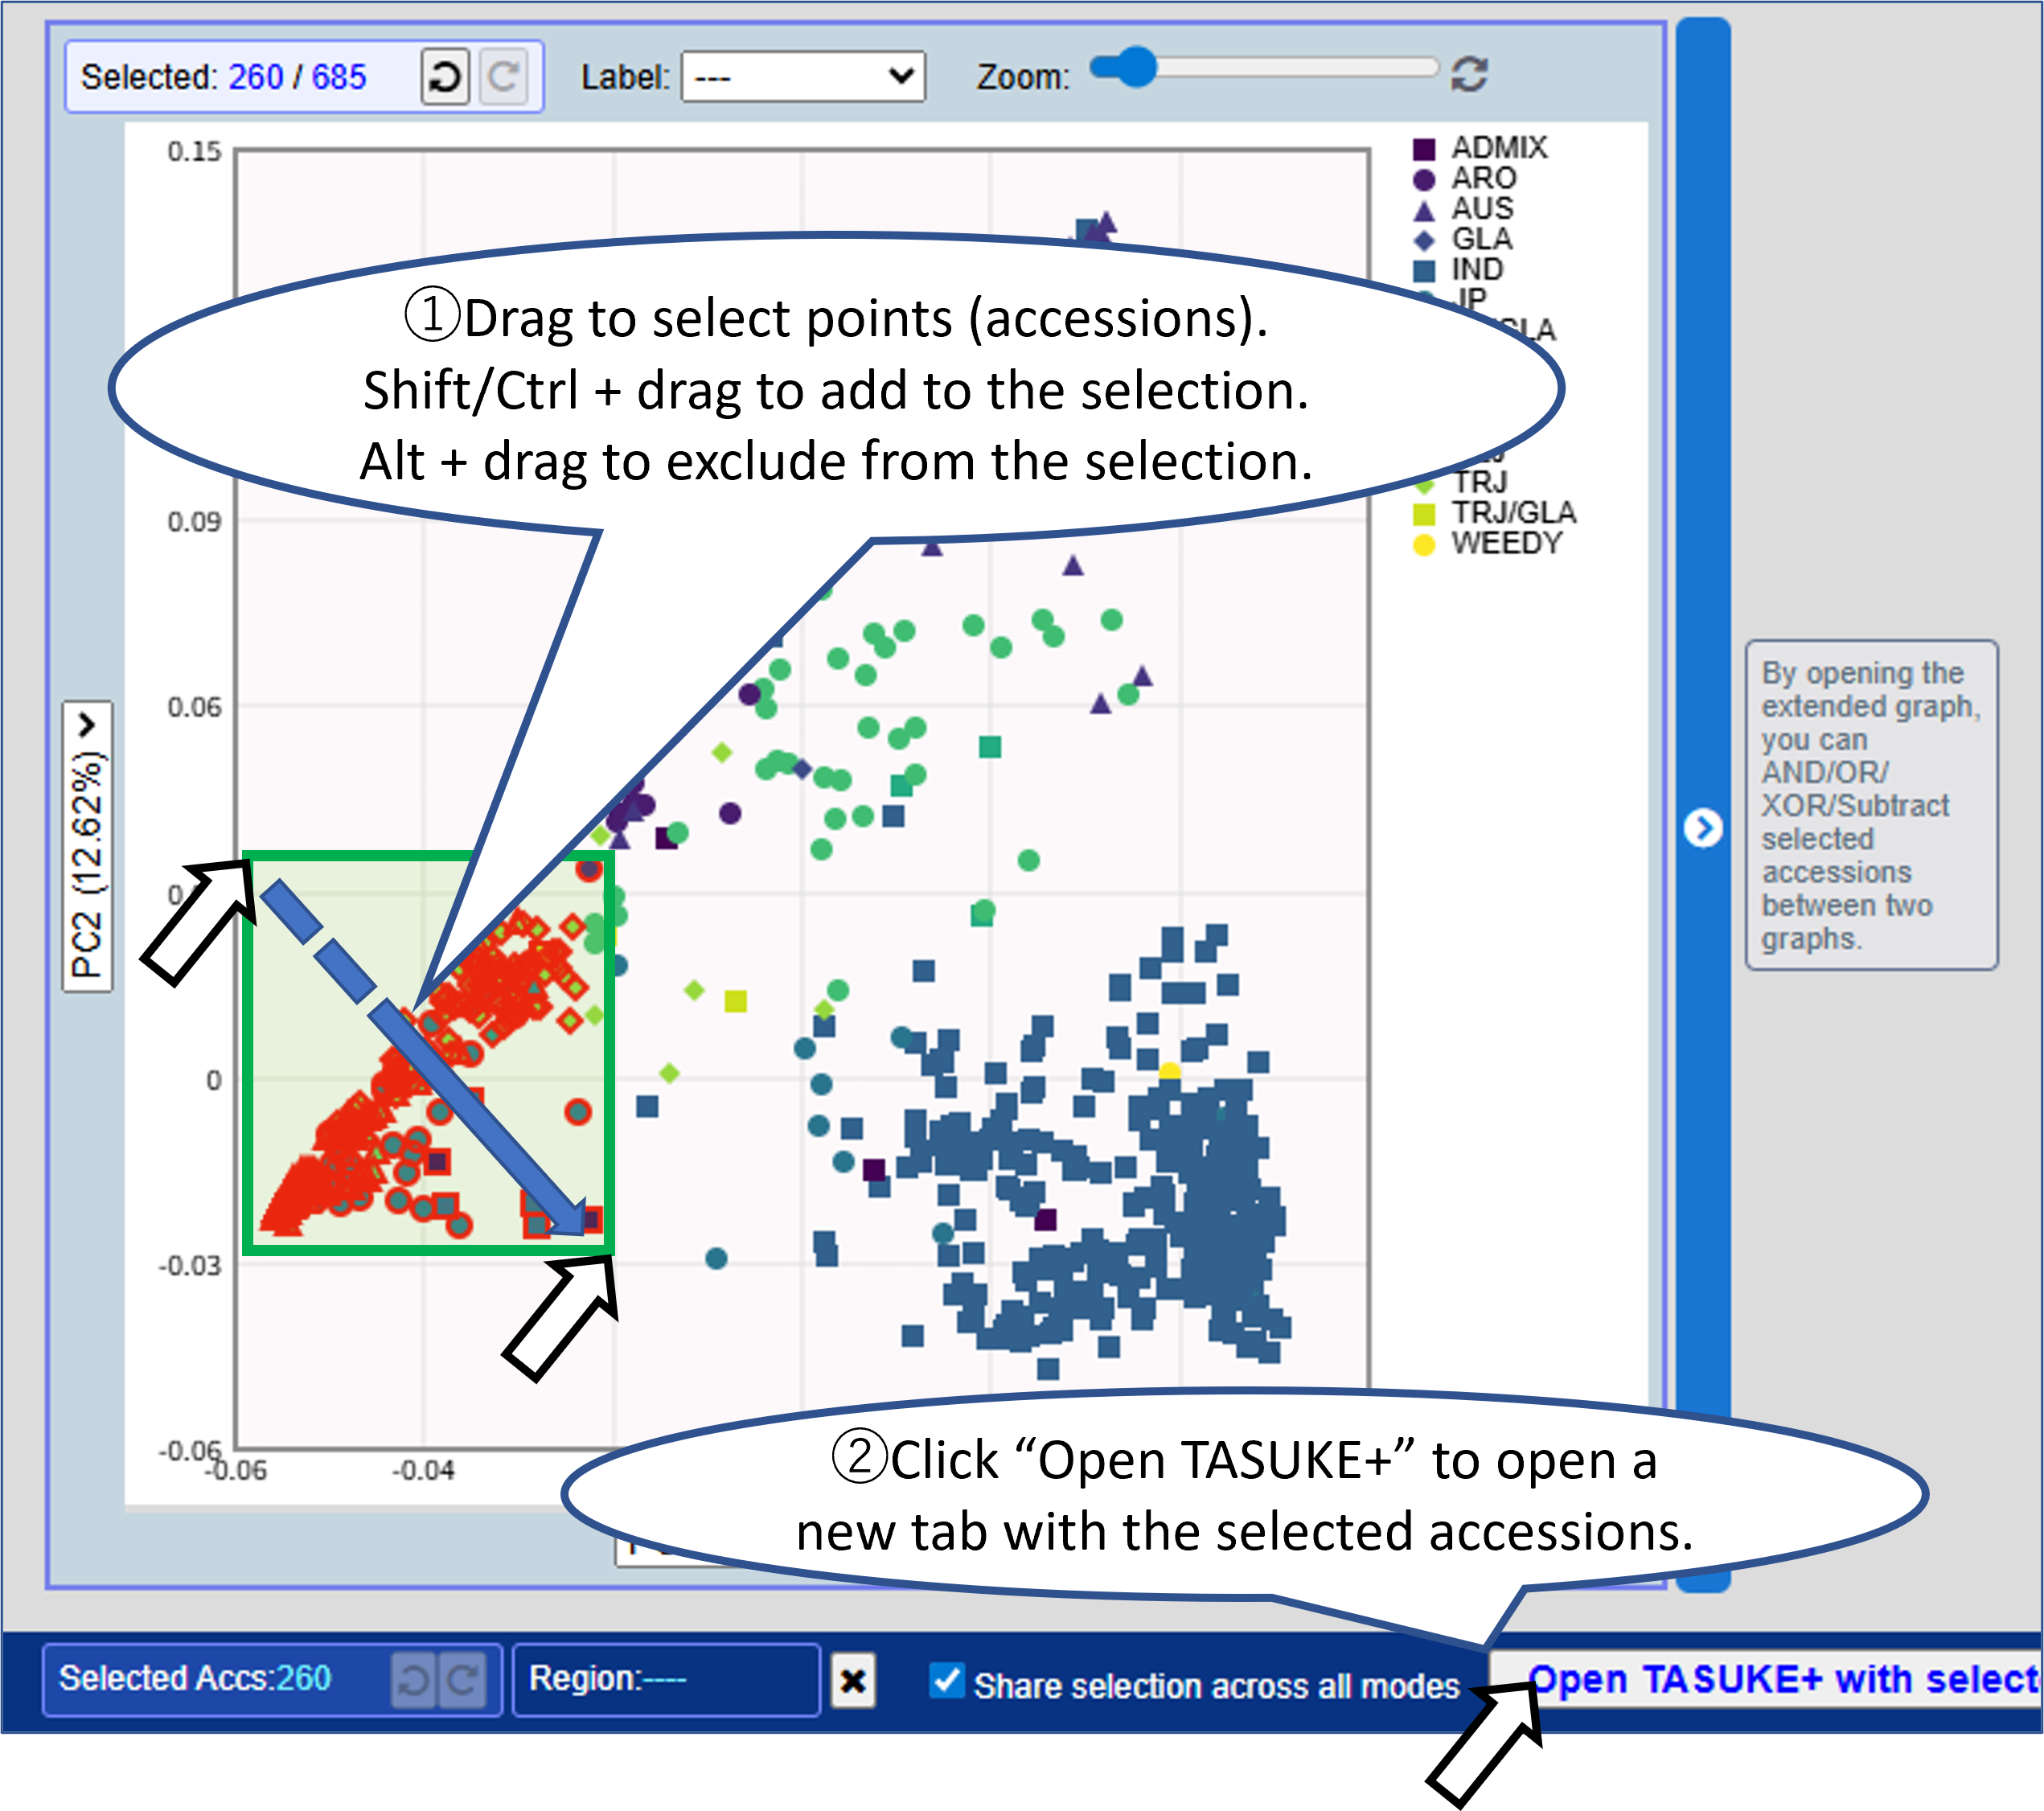
Opening the extended graph allows you to combine selections between two graphs.
Choose any principal components for the X and Y axes.
Enable "Synchronize selections" to reflect the accession selection in both graphs.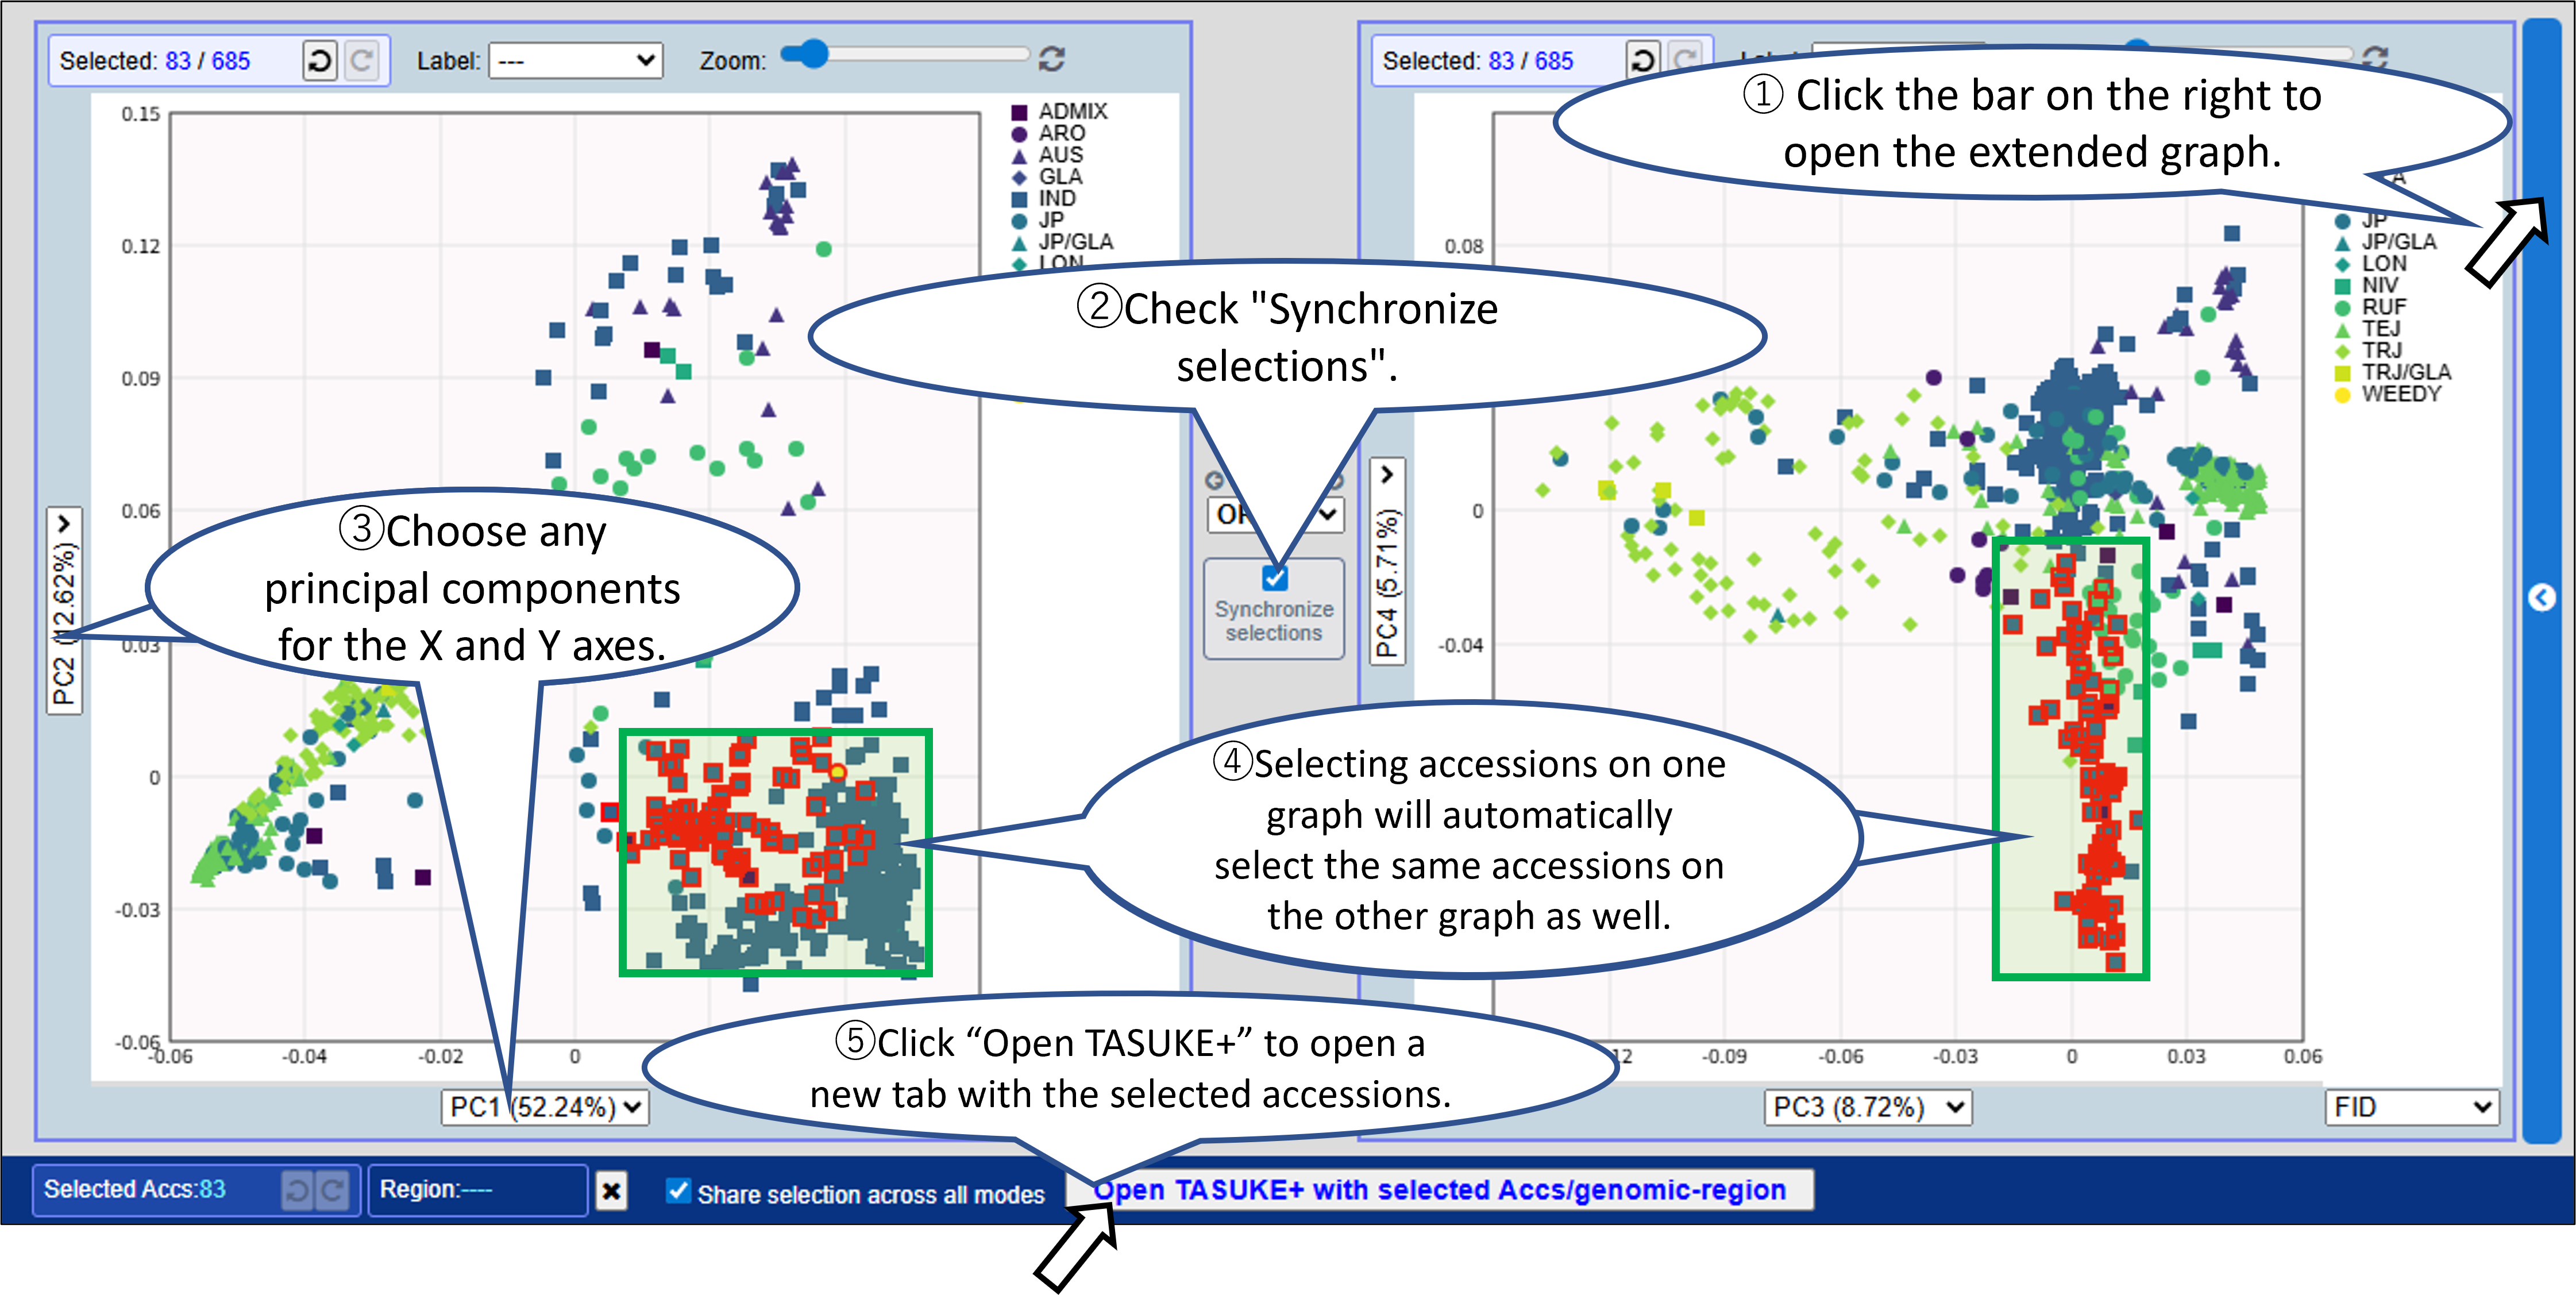
You can combine selections between two graphs using: AND/OR/XOR/Subtract.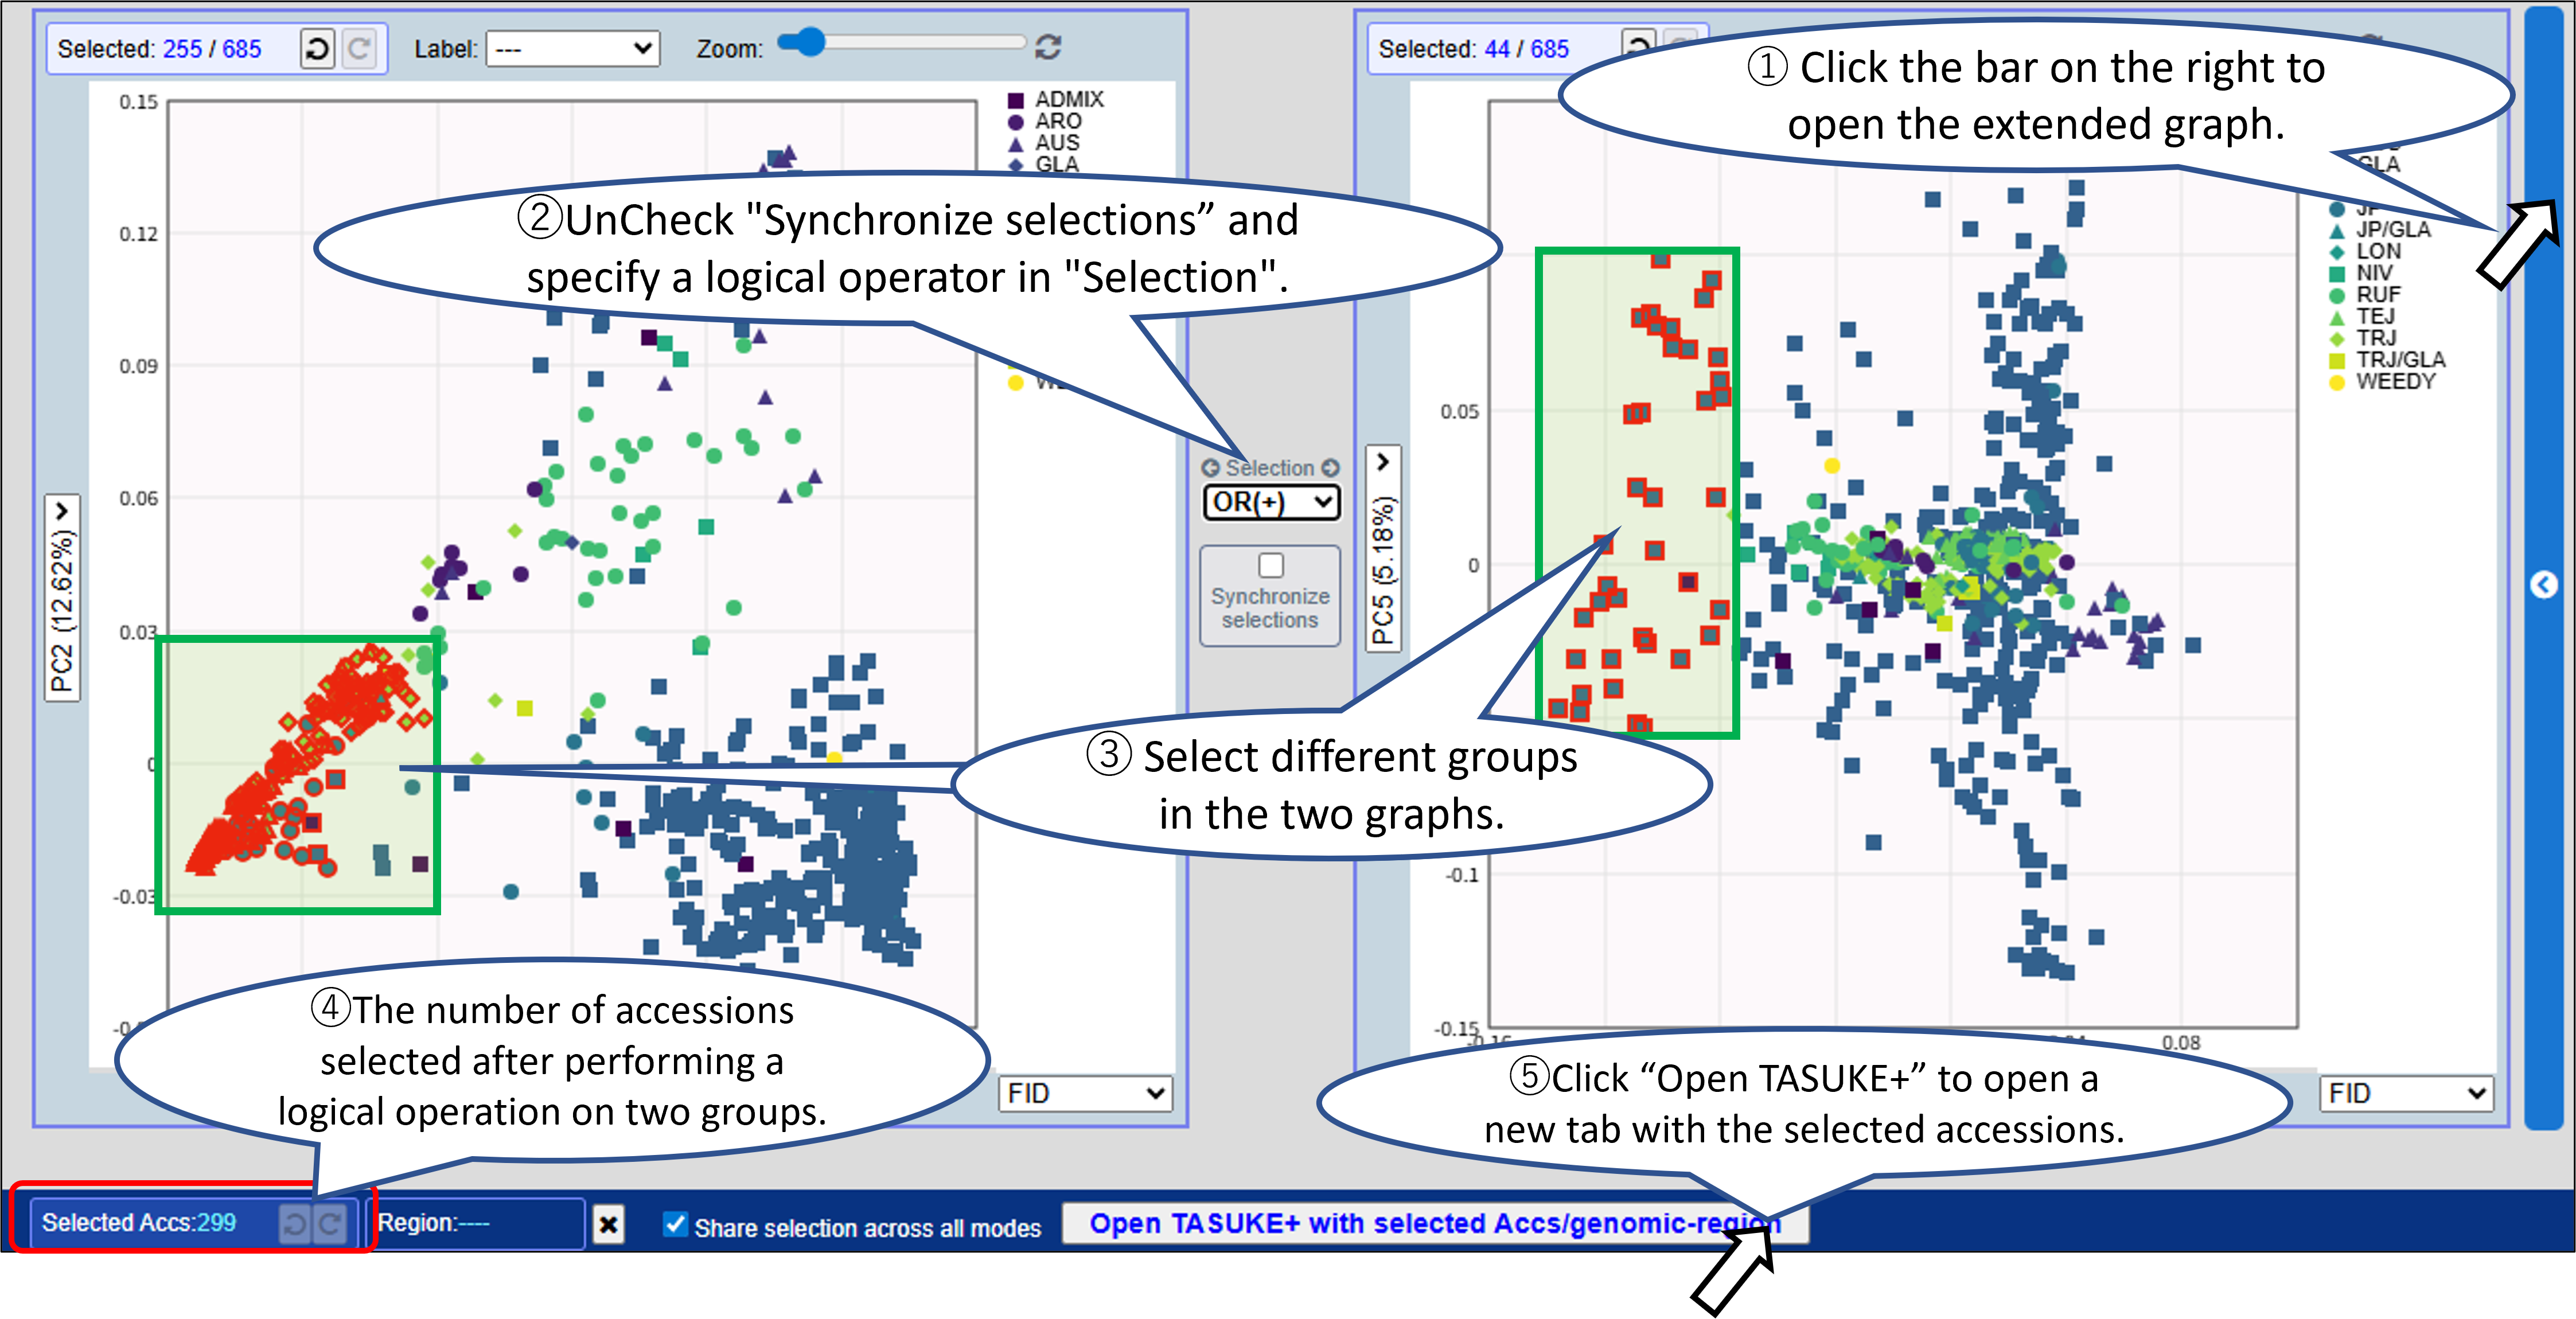
Selections are shared across all display modes, allowing you to compare genomic features across different analyses.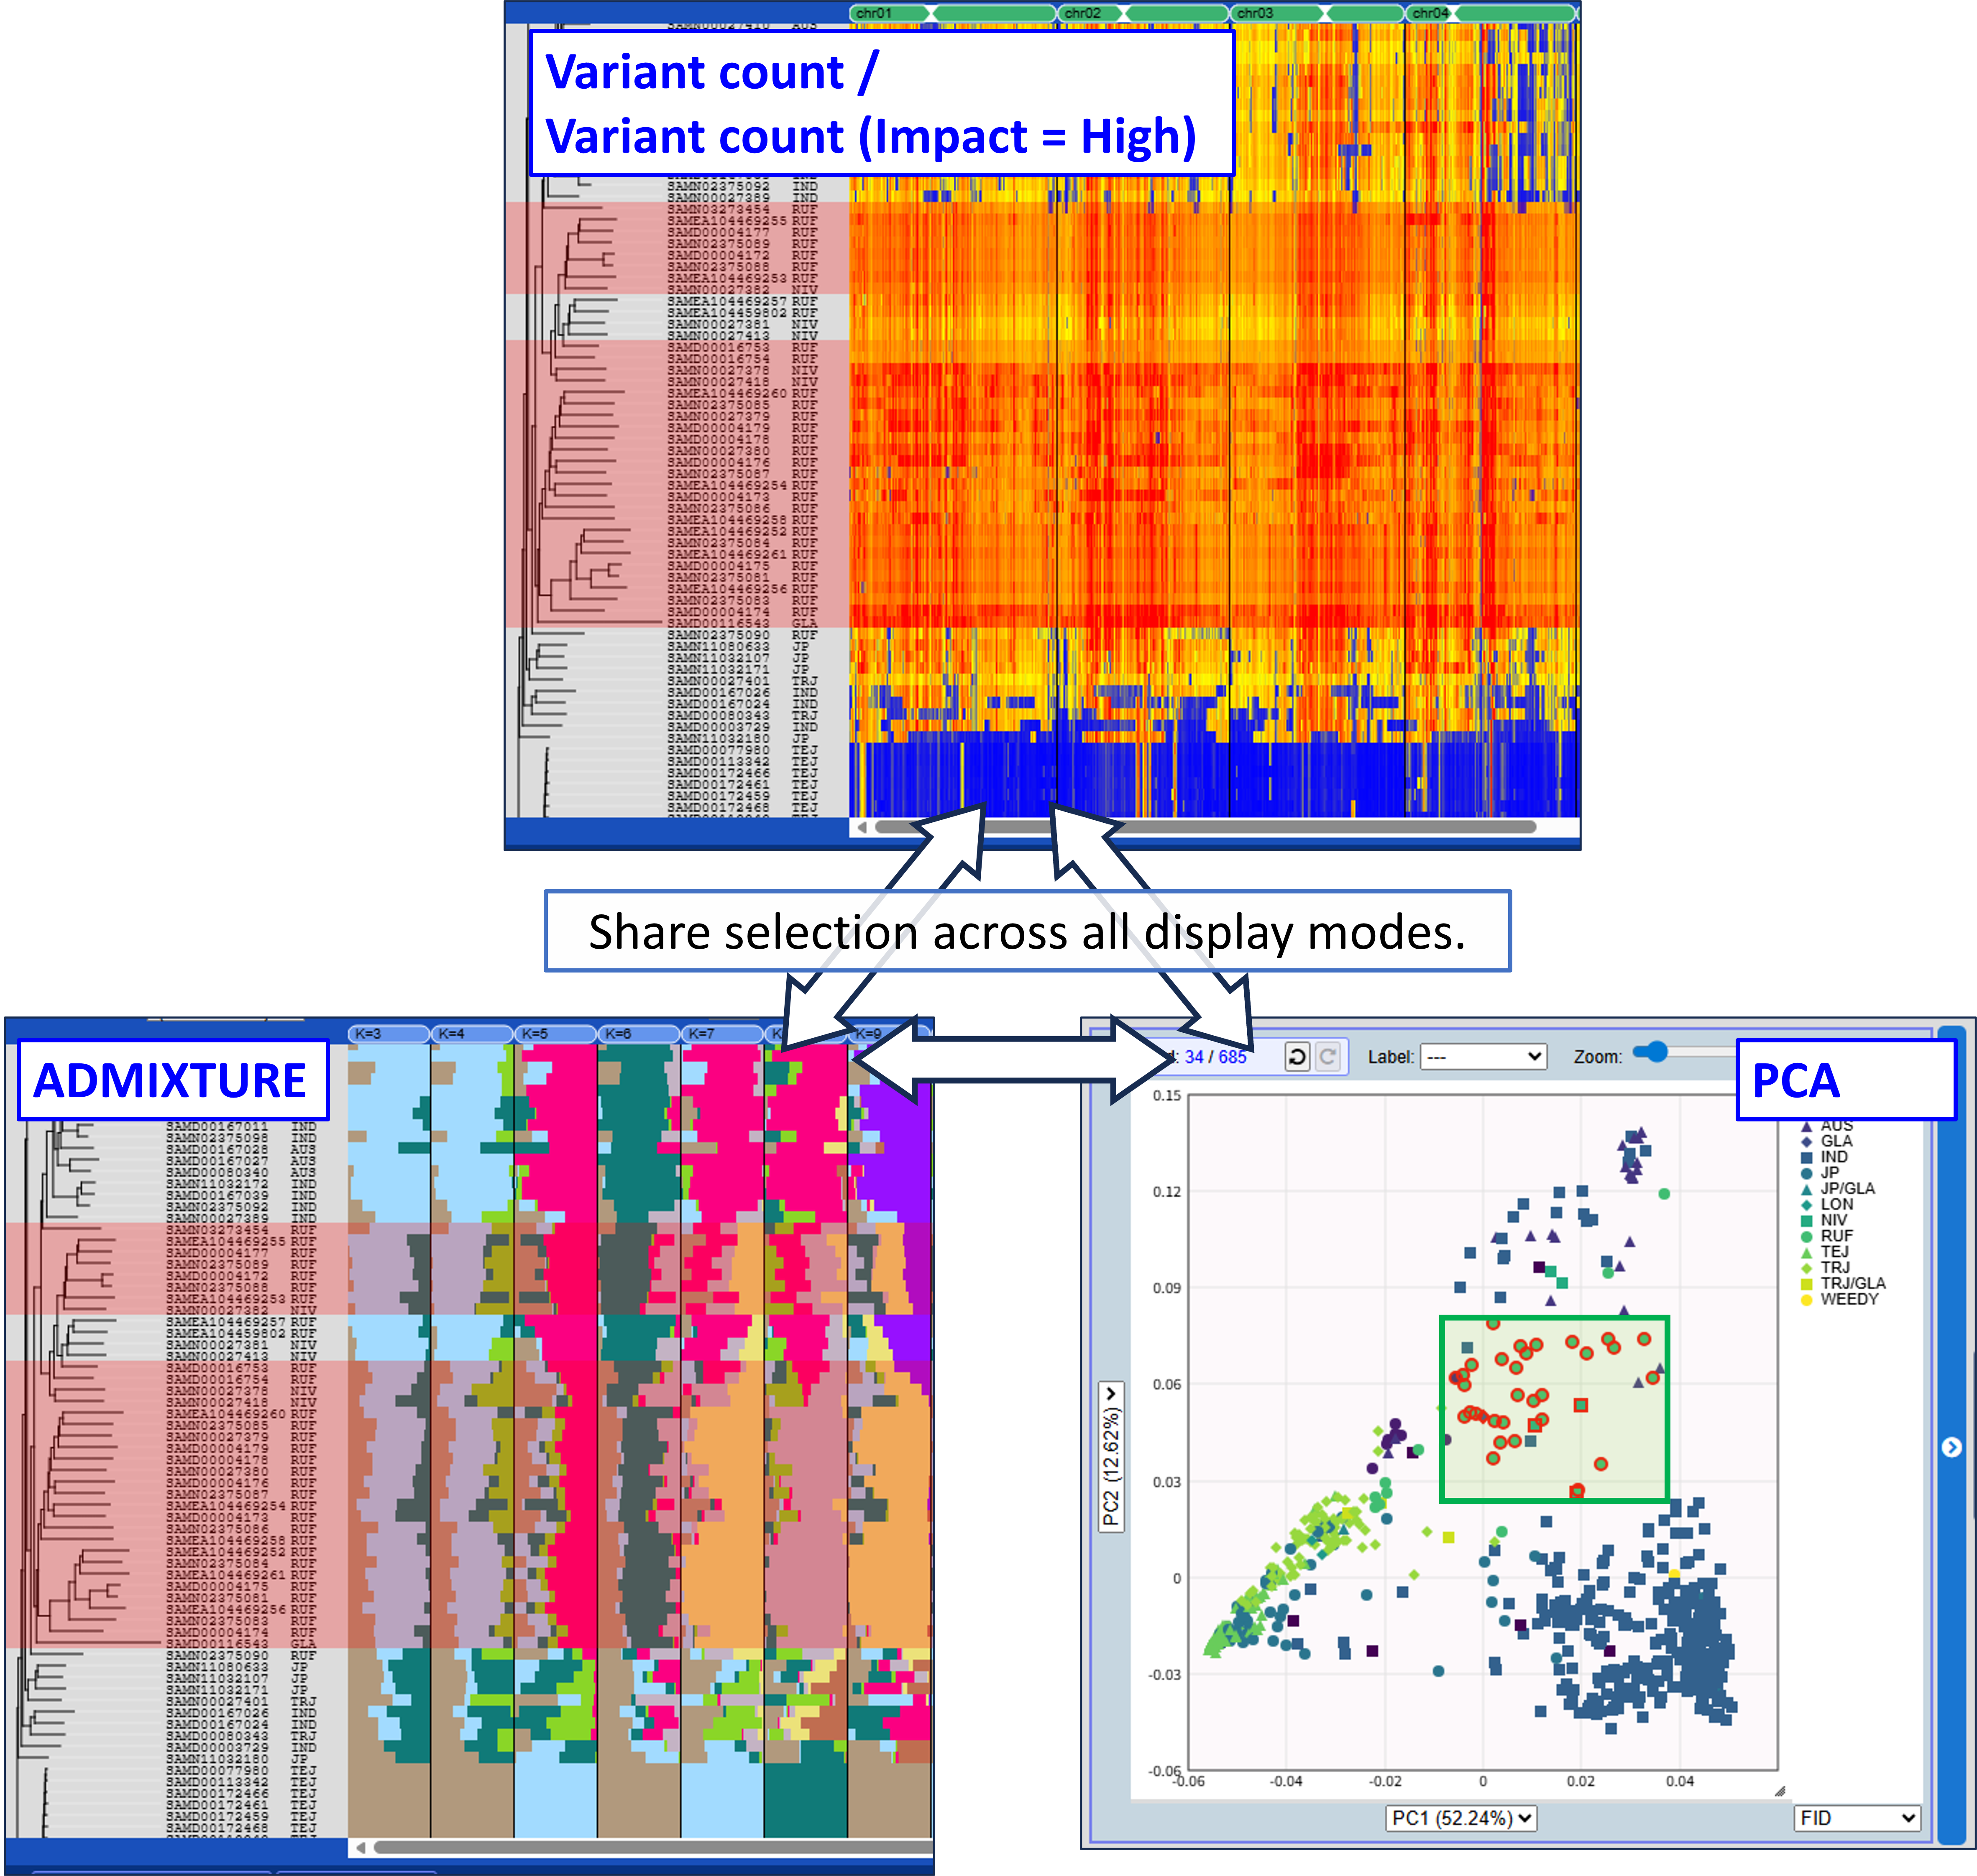
Accession list
"Selection > Accession list" from the top menu opens a dialog similar to AccessionManager on the TASUKE main page. Checking a row selects the corresponding accession in the graph.
For detailed usage instructions, please refer to "AccessionManager".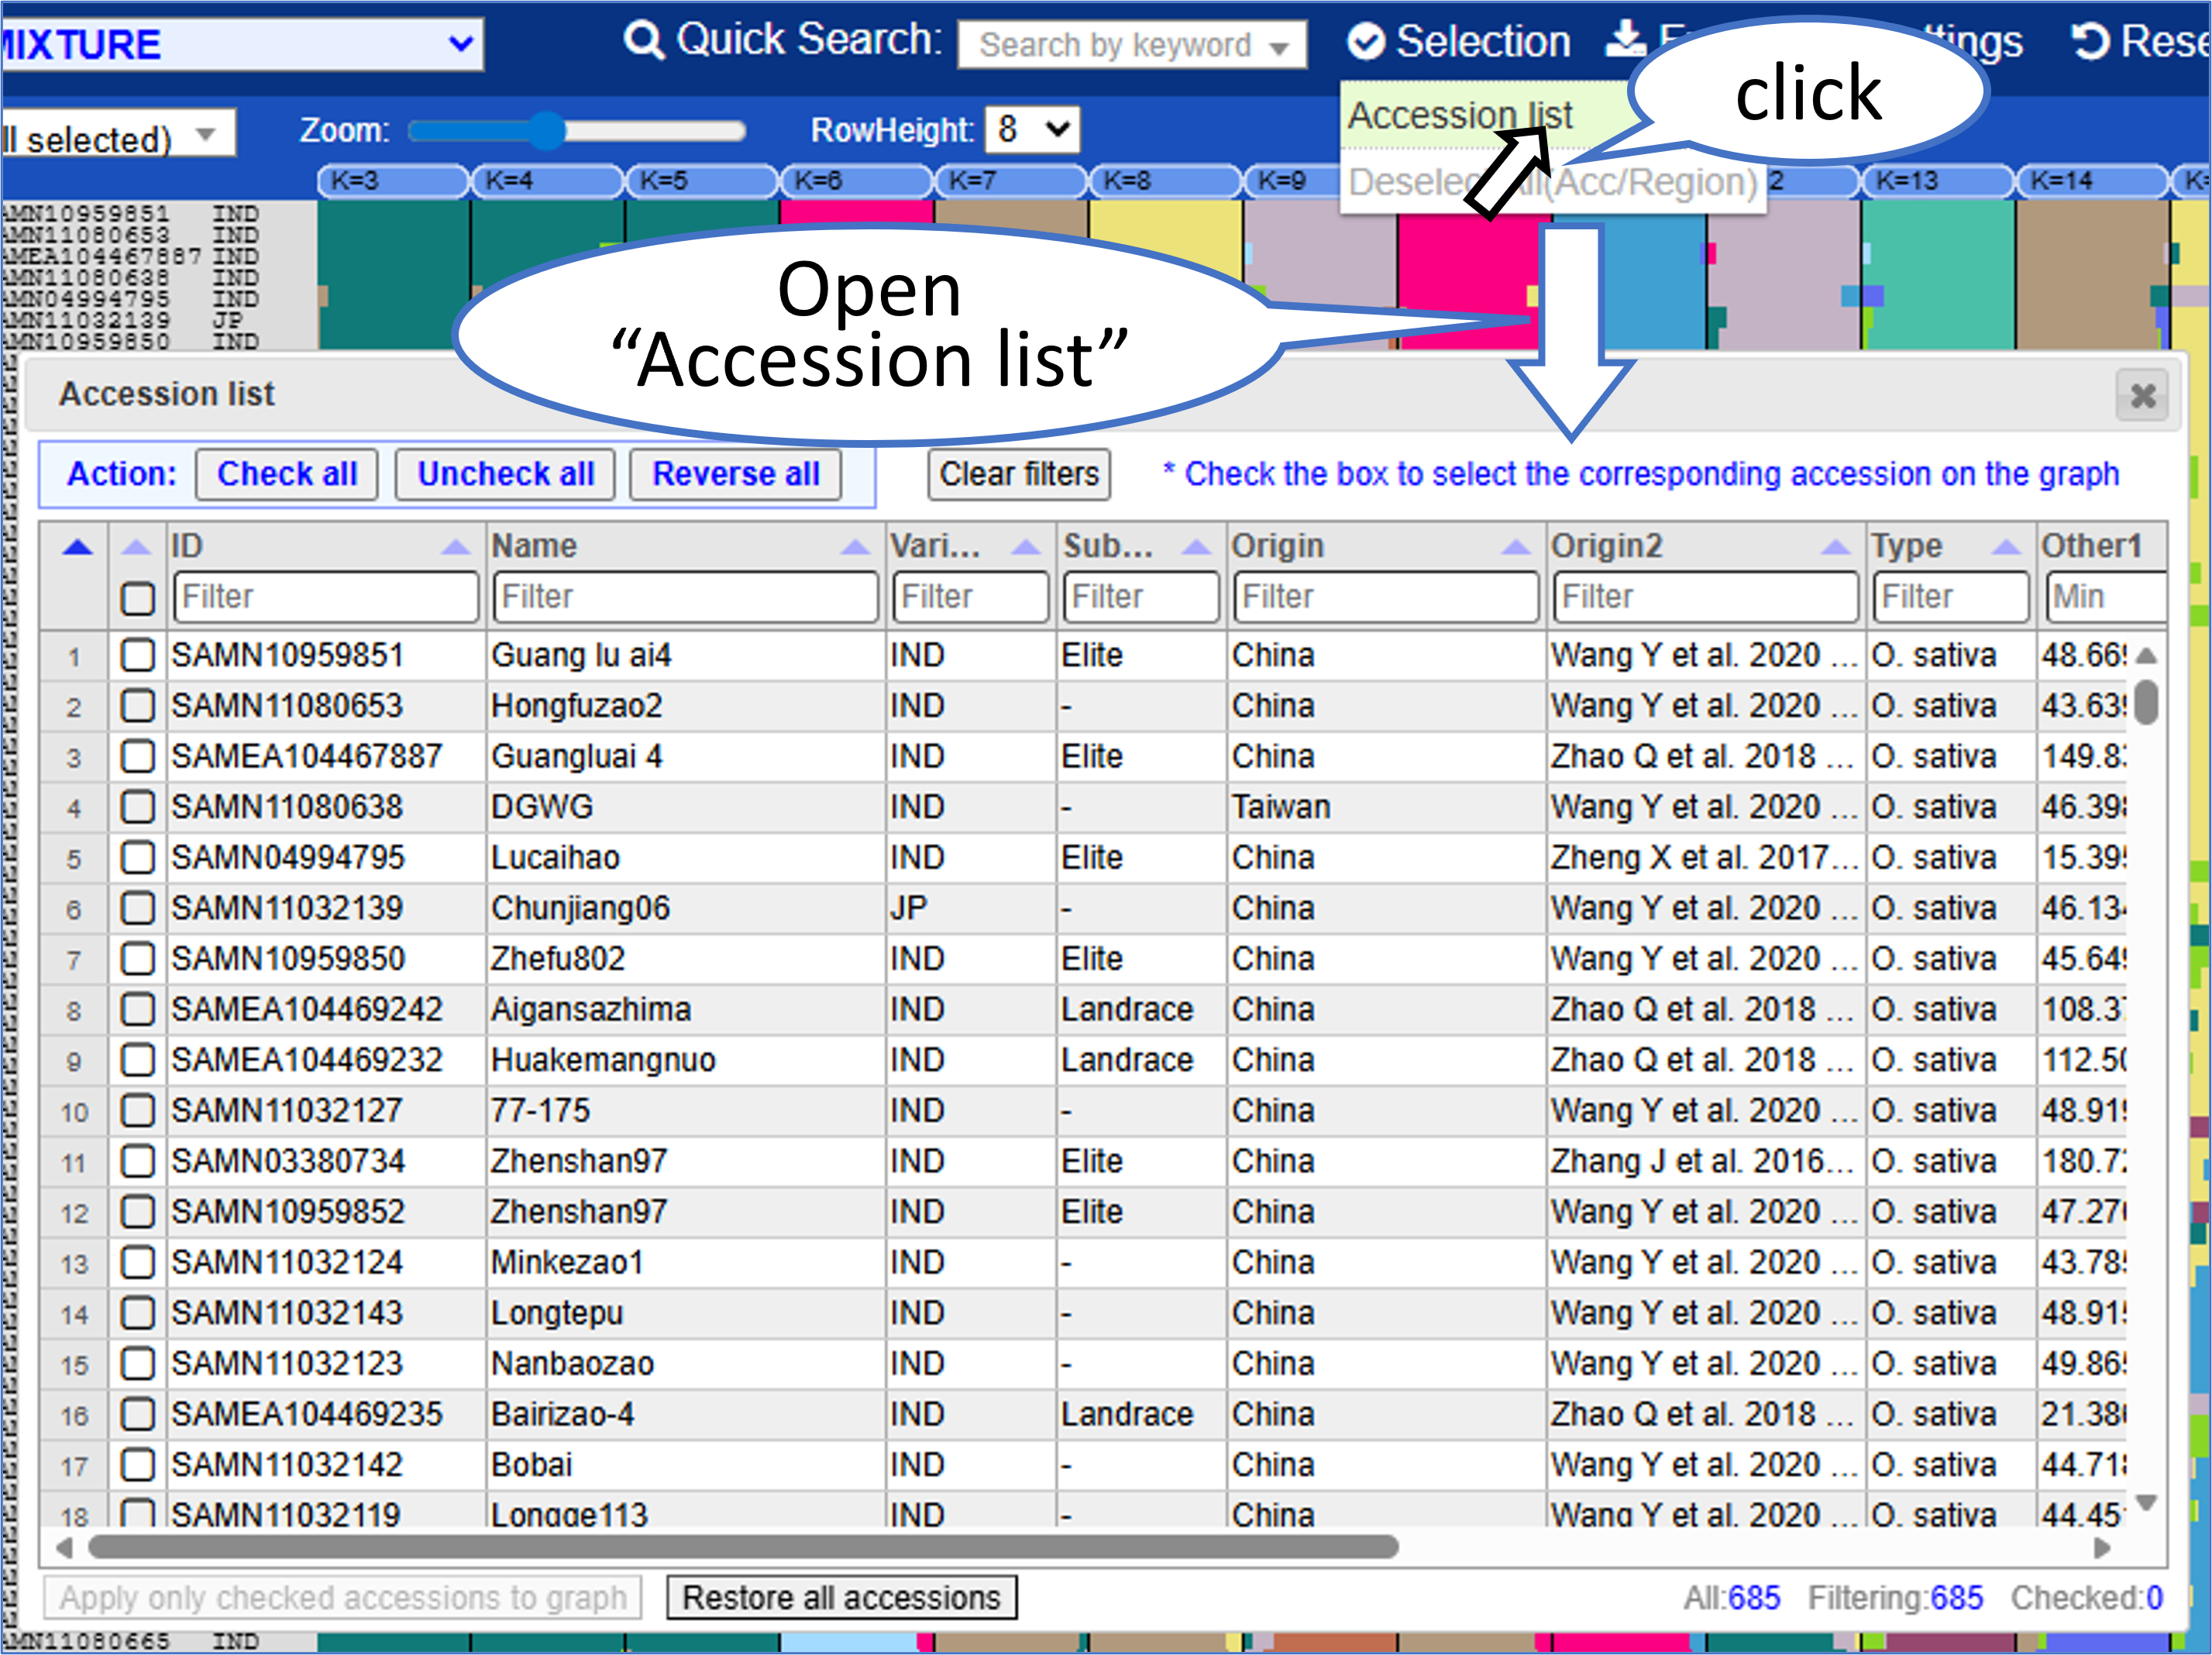
The Macro Viewer provides an overview of the TASUKE dataset by multiple genomic analysis.
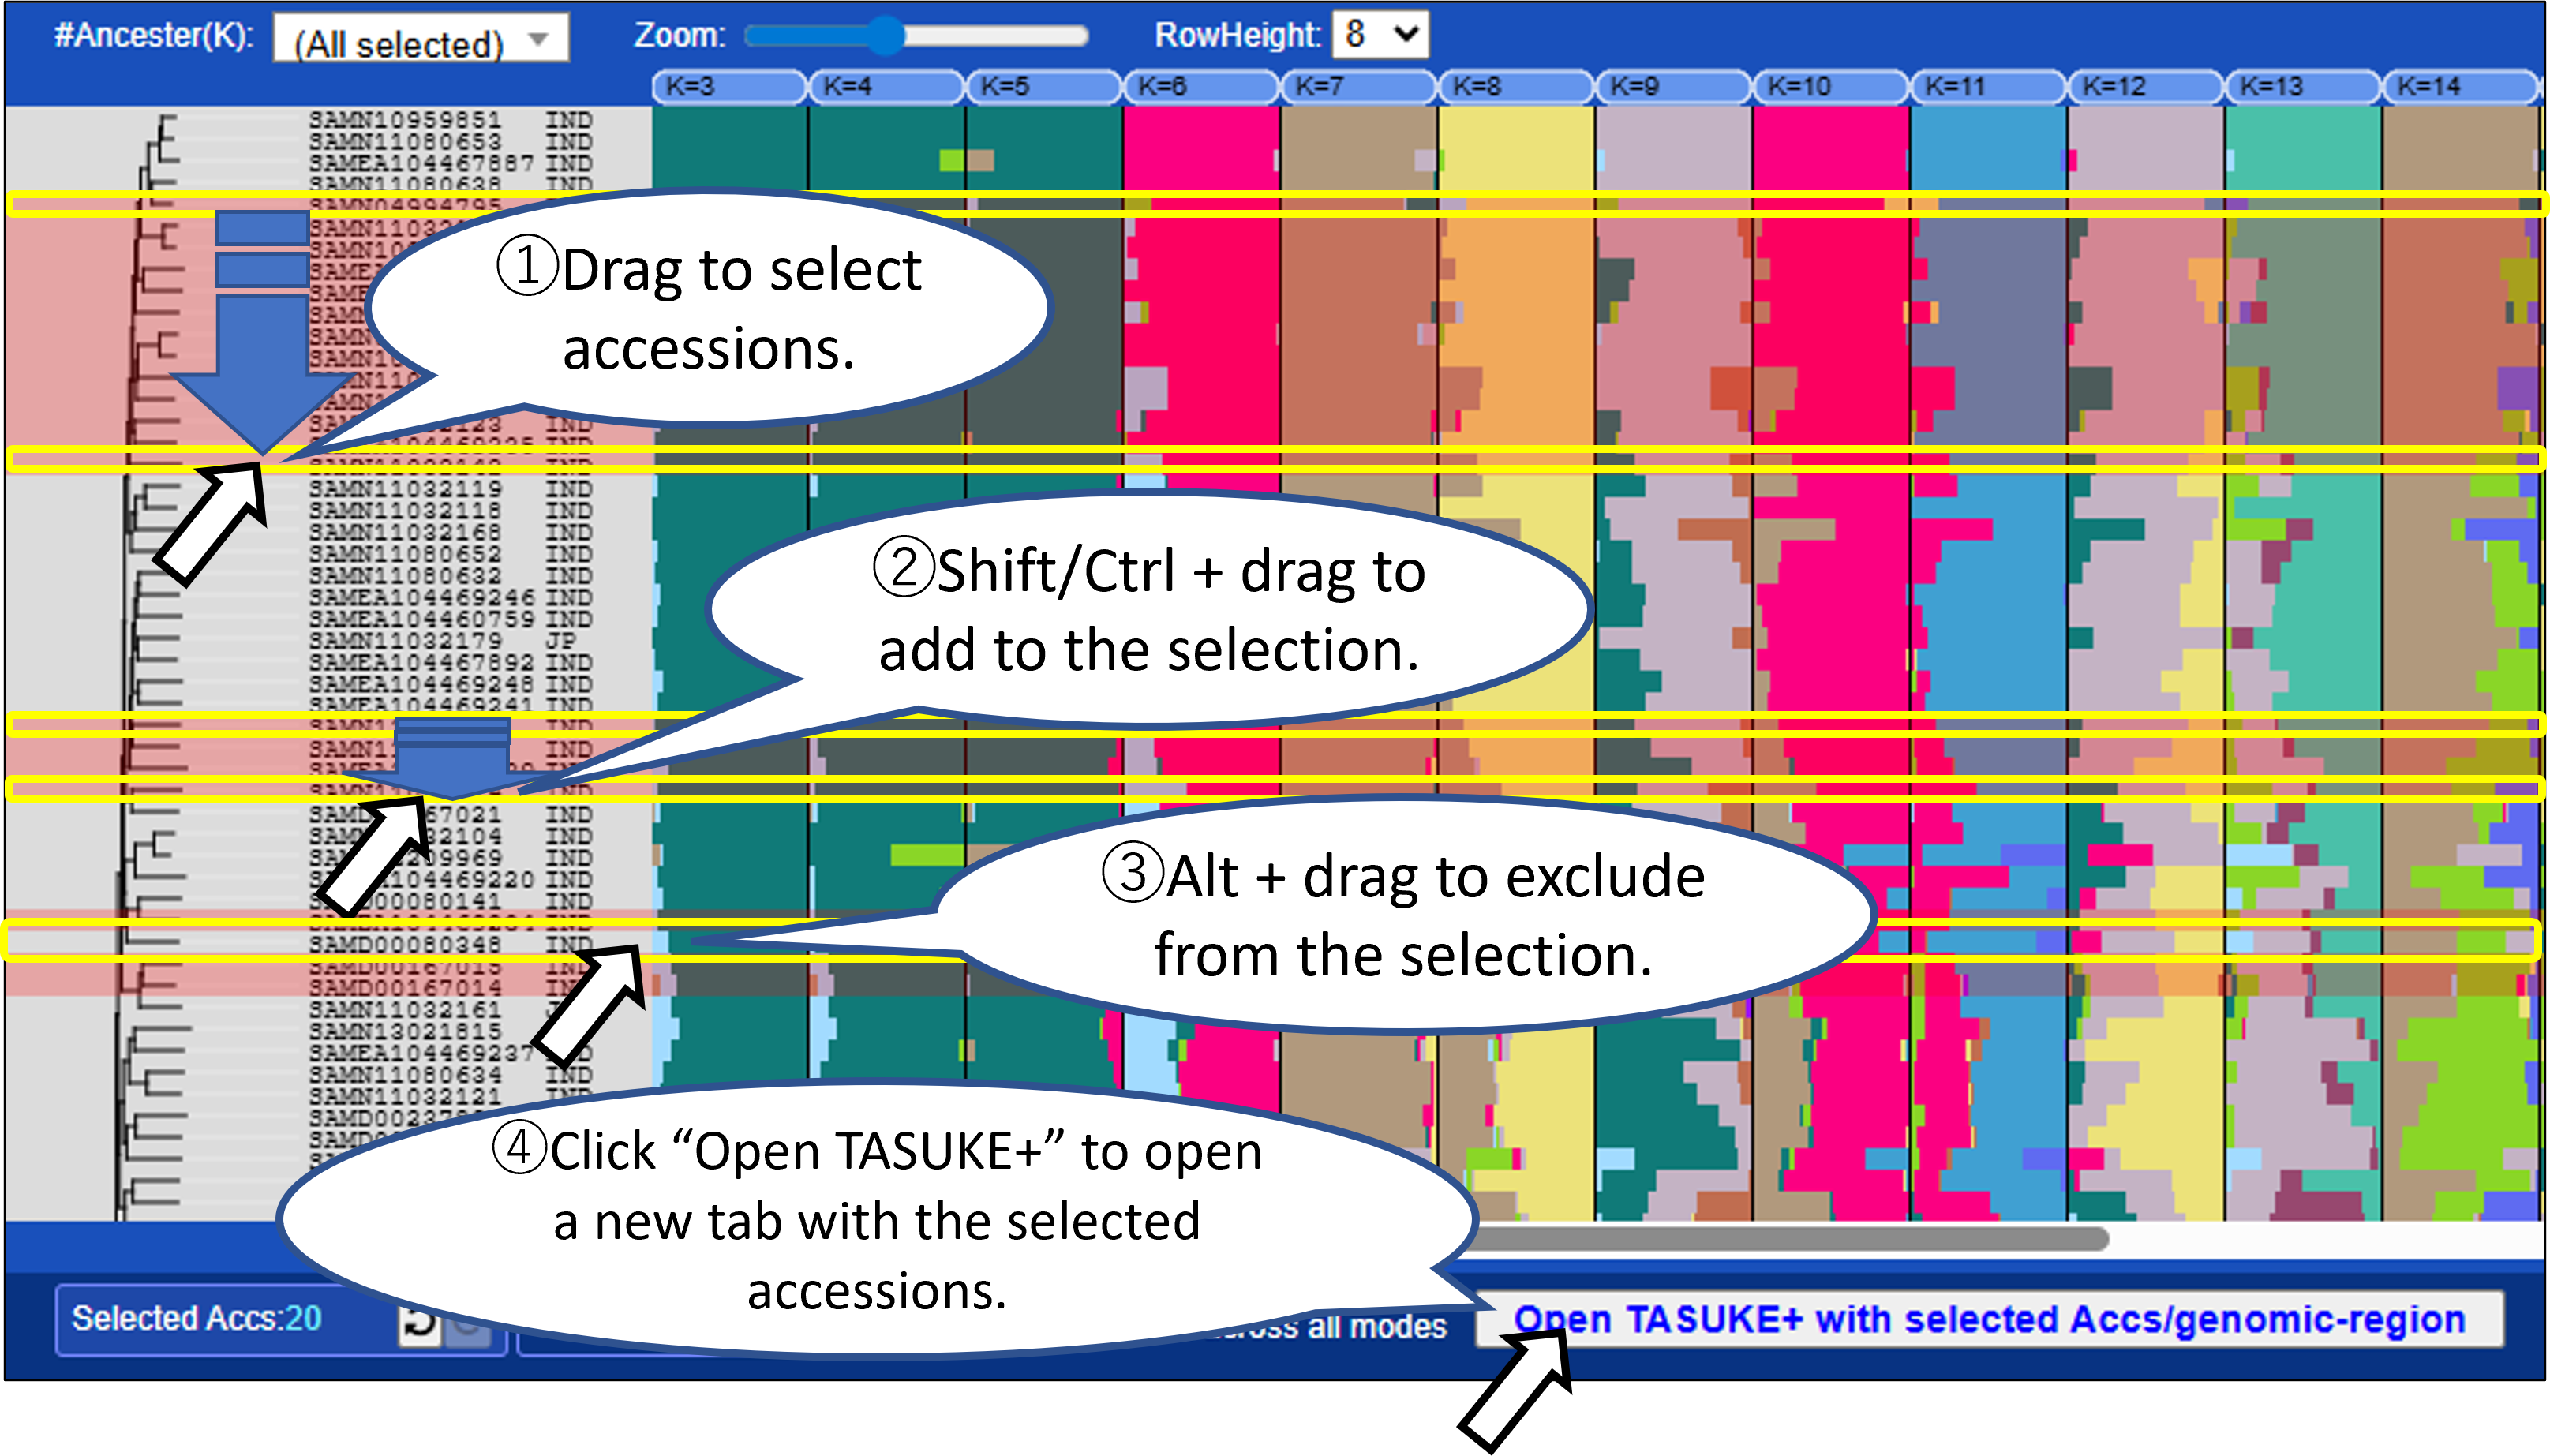
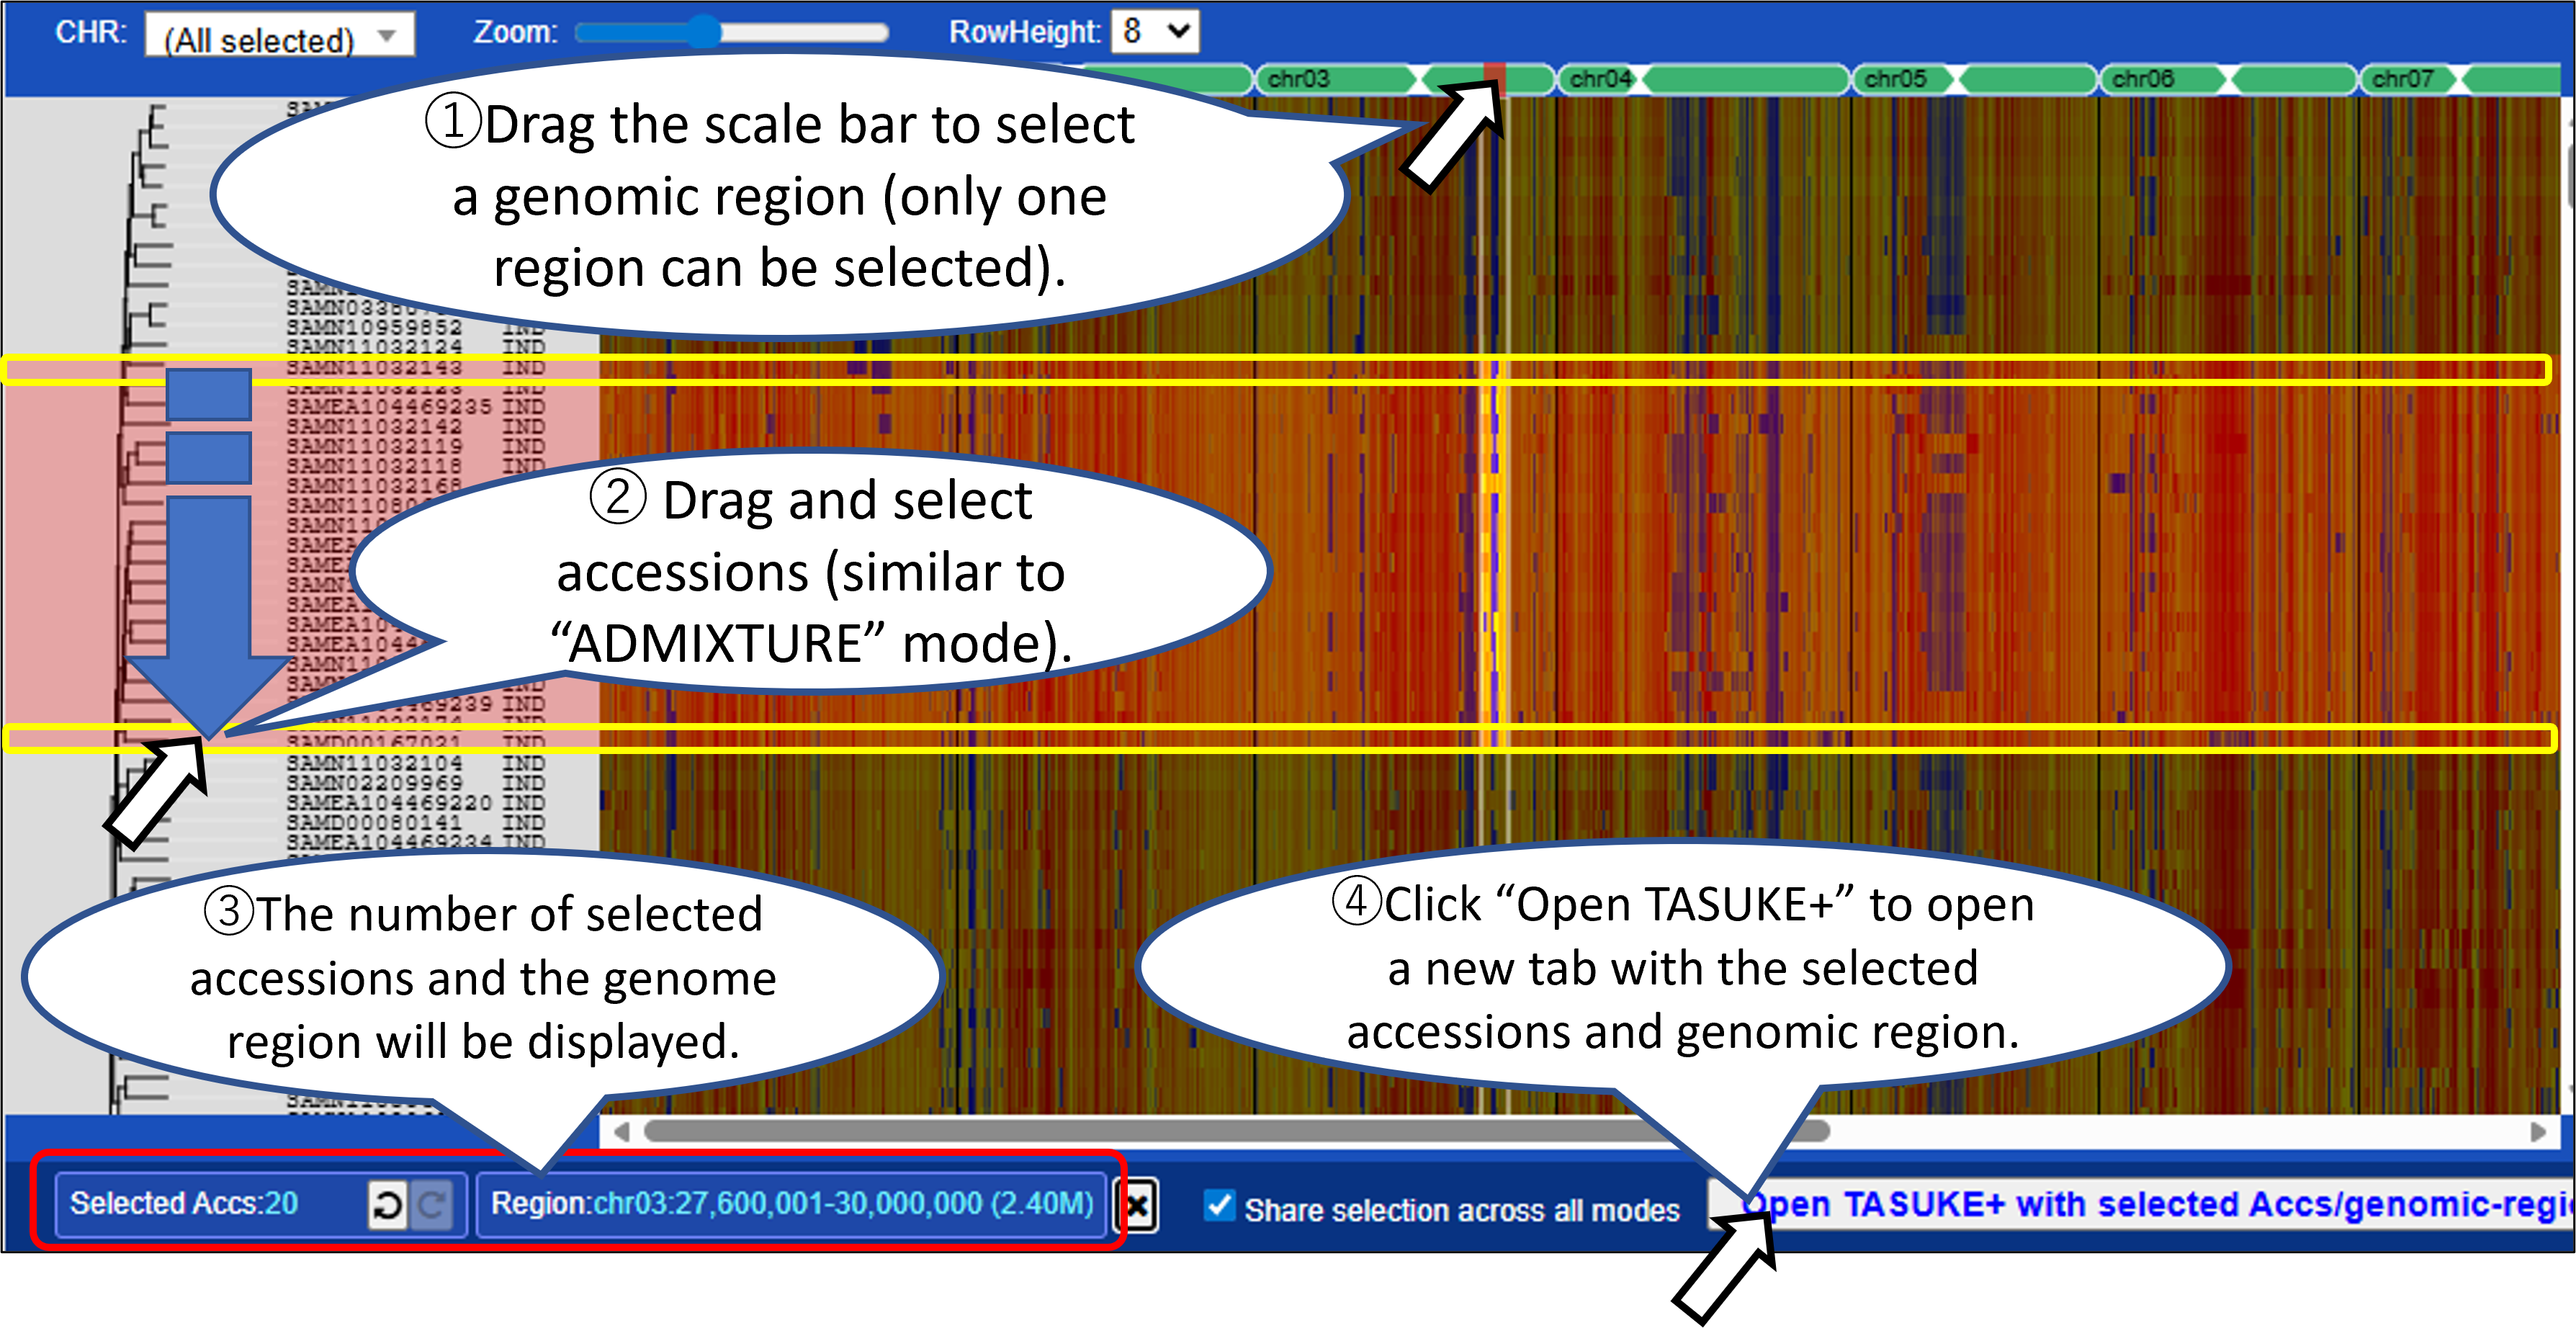
- You can select samples (accessions) and/or a genomic region from graph by mouse dragging or from the Accession list with filtering for metadata. Click “Open TASUKE+” to open a new tab with the selected accessions and genomic region.
- Selections are shared across all display modes, allowing you to compare genomic features across different analyses.
Mode1: ADMIXTURE
Displays the ancestry fraction (Q matrices) of ADMIXTURE results as bar plots. Results for multiple K (number of population assumed) can be shown in parallel.
Mode2,3: Variant count / Variant count (Impact = High)
Displays variant density across the genome as a heatmap with windows (fixed size e.g., 100kb). Variant count (Impact = High) mode shows high-impact variants predicted by SnpEff.
Mode4: PCA
Displays a two-dimensional scatter plot from principal component analysis (PCA).
Opening the extended graph allows you to combine selections between two graphs.
Choose any principal components for the X and Y axes.
Enable "Synchronize selections" to reflect the accession selection in both graphs.
You can combine selections between two graphs using: AND/OR/XOR/Subtract.
Selections are shared across all display modes, allowing you to compare genomic features across different analyses.
Accession list
"Selection > Accession list" from the top menu opens a dialog similar to AccessionManager on the TASUKE main page. Checking a row selects the corresponding accession in the graph.
For detailed usage instructions, please refer to "AccessionManager".